- The Range
- Posts
- Volatility Takes a Bit of a Breather Ahead of Inflation and a Pickup in Earnings
Volatility Takes a Bit of a Breather Ahead of Inflation and a Pickup in Earnings
Volatility Lingers Even as Attention Shifts to Fundamentals
👋 Hello and welcome to Monday! 🌅
Here’s what we’re watching:
Inflation data returns to center stage, with energy costs likely driving the upside
Fed expected to stay on hold as markets digest mixed inflation signals
Earnings growth remains strong, but rising costs could pressure margins
Even as volatility edges low, the S&P stays vulnerable to outsized daily swings
Let’s rock!🥁🎶🎤

🔍The next big test: inflation prints and fed expectations
Markets are still taking their cues from geopolitical headlines. During any the rare Middle East headline droughts, however, investors will also be focused on the usual drivers, such as inflation and earnings.
Friday brings the latest read on the Consumer Price Index for March, one of the most closely watched snapshots of where prices are headed. Expectations are for a noticeable pickup month-over-month, with year-over-year inflation also ticking higher. Unlike last month’s report, this one should start to reflect the ripple effects from the conflict in Iran—particularly through energy prices.
Before that, Thursday delivers the Personal Consumption Expenditures Price Index, the Fed’s preferred inflation measure. It’s a bit backward-looking (February data), but still important for policy direction. Right now, traders are betting the Federal Reserve stays on hold at its next meeting later this month.
💵 What’s the market pricing in for the week ahead?
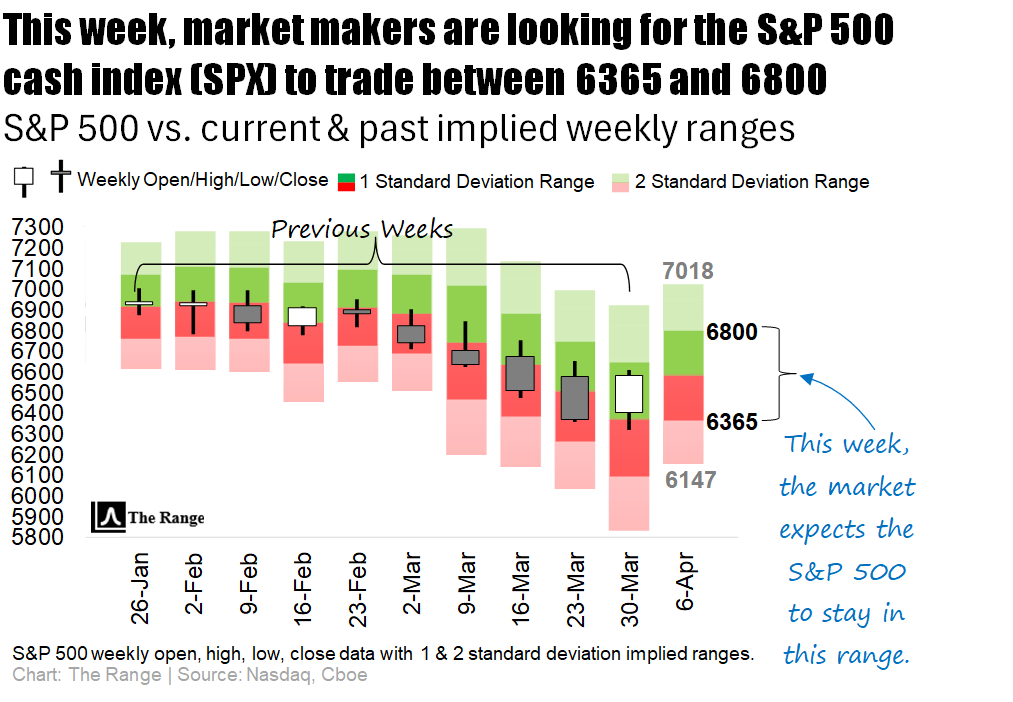
ℹ️ WHY IS THIS IMPORTANT?
Knowing what the implied weekly range is helps traders set expectations for what the likely trading limits will be. This can help prevent overreaction near quantified range extremes, while also providing perspective on whether there is still room for an intra-week rally or sell-off to run.
📝 Note: This same logic can also be applied to the “Where’s the Action At?” section below.
Click here 👈 to learn more about our charts.

📈 Corporate America braces for higher costs
Earnings season is quietly picking up steam. Companies like Delta Air Lines and Constellation Brands are set to report, offering a read on both travel demand and consumer spending habits. And yes, they’re watching oil prices just as closely as everyone else—because fuel costs don’t just hit margins, they shape pricing decisions too.
Zooming out, expectations are still relatively upbeat. Analysts are looking for another quarter of solid, double-digit earnings growth for the S&P 500. Not bad, considering the backdrop.
🤔 Which companies are poised to possibly over- or underreact to earnings this week?
The largest company to report earnings this week, Delta Airlines, has a history of trading very close to the market makers’ expected range during the trading session immediately following earnings (keep reading below the next table for more details on how this is calculated).
Of the 20 largest companies reporting earnings this week, Genie Energy has the greatest tendency to overshoot the implied price range immediately following earnings is greatest.
On the other side of the coin, of the top 20 companies reporting this week, Encore Energy shows the greatest likelihood of staying inside its post-earnings expected range (keep reading below the next table for more details).
👇 Below is a look at this week’s biggest earnings reports, sorted by market cap:

HOW CAN TRADERS USE THIS INFORMATION?
For active traders looking to trade some of this week’s earnings plays, the highlighted columns on the table above show the implied (expected) post-earnings move for each company, along with the Average 1-Day Realized Volatility Post-Earnings Ratio (1D RV).
📈 Implied Move: The market’s best guess at how much a stock will swing after earnings.
📊 1D RV: A powerful tool that represents the post-earnings price move divided by the expected price move over the past 12 quarters. In other words, it measures how good (or bad) the market is at pricing each company’s earnings.
💵 When you see a ratio >1.0, it indicates that, historically, the earnings are mispriced and the stock moves MORE than the market anticipates, favoring straddle buyers.
🪝 A ratio <1.0 tells the opposite story, meaning the stock historically moves LESS than the market anticipates, which favors straddle sellers.
Happy hunting.

Currently, the energy (XLE), technology (XLK), and consumer discretionary (XLY) sectors are leading the pack as the top three sectors with the highest implied volatility. Options traders are clearly bracing for a bumpy ride as geopolitical tensions and high-stakes data collide.
Next week, investors in the energy sector (XLE) will be laser-focused on the results of critical US-Iran diplomatic negotiations regarding the Strait of Hormuz. Those watching the technology sector (XLK) will be scrutinizing the latest first-quarter earnings forecasts for signs that the AI boom can sustain its momentum. Finally, for the consumer discretionary sector (XLY), the most important watch item will be the market's delayed reaction to the March non-farm payrolls report.
On the flip side, some corners of the market are keeping it cool. The real estate (XLRE), the consumer staples (XLP), and the communication services (XLC) sectors currently hold the title for the lowest implied volatility, serving as the market's relative "safe havens".
For the real estate sector (XLRE), next week's big focus is the 10-year Treasury yield, as any further climb could squeeze developers facing a "debt maturity wall". Investors in the consumer staples sector (XLP) will be monitoring whether defensive rotation continues as a hedge against potential 2026 recession risks. Meanwhile, the communication services sector (XLC) will have its eyes on the University of Michigan Consumer Sentiment release to gauge the future health of digital ad spending.
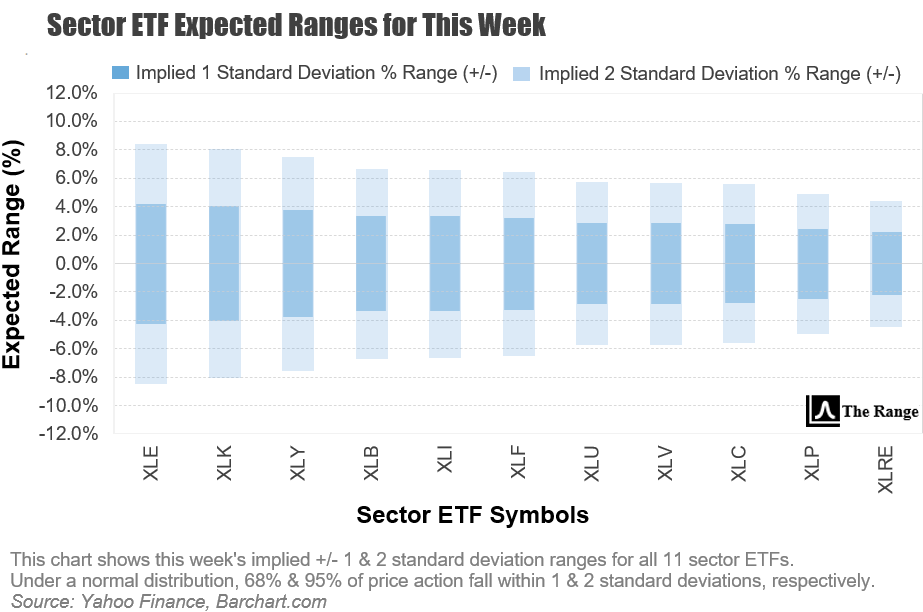
ℹ️ WHY IS THIS IMPORTANT?
For options traders in particular: Implied volatility sets the tone for option prices. Understanding where large or small implied moves are priced in helps traders decide whether options are over- or under-valued before placing trades.

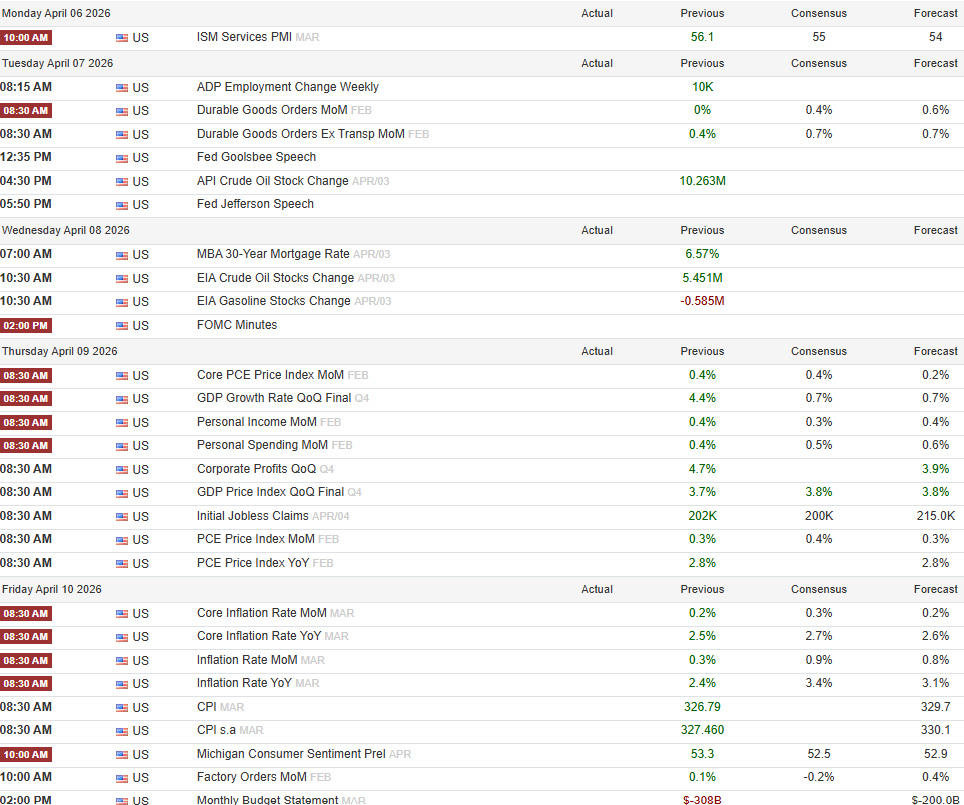
Source: Tradingeconomics.com

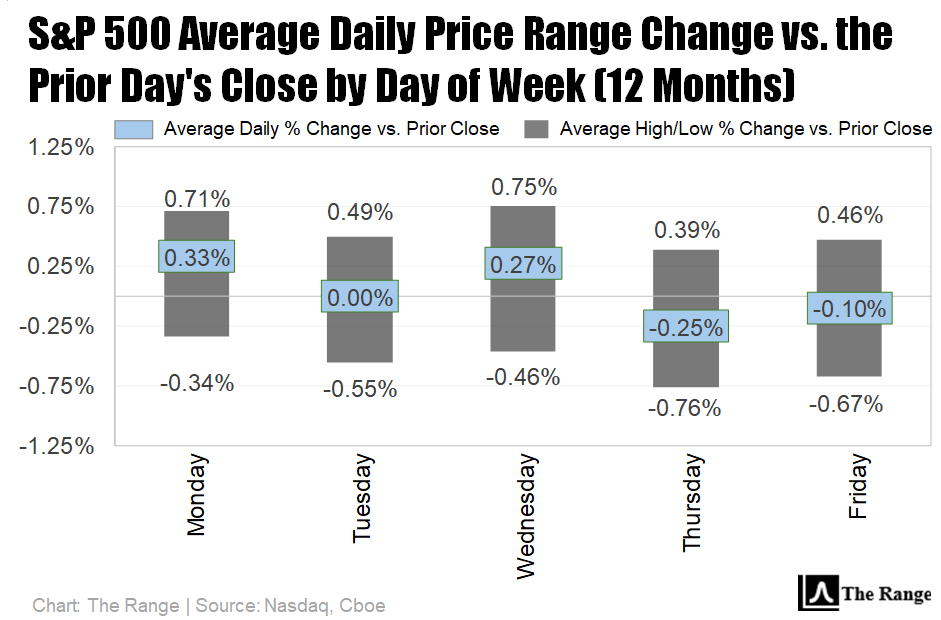
Although volatility in the form of the Cboe Volatility Index (VIX) fell last week, the S&P 500 moved outside of its normal daily ranges during each day of this holiday-shortened period.
With the VIX still firmly above the 20 level, however, volatility remains elevated. Therefore, the benchmark equity index’s unusually large daily swings are likely to continue this week.
📝 EDITOR’S NOTE
Each day the market is open, we update our comprehensive performance charts on our website for you to view. In addition, be sure to follow us on X for timely intra-week updates.

📋Here’s a curated list of top value-added insights that uncover what’s happening way beyond the usual financial media headlines.

Gif by warnerbrosde on Giphy
Please be sure to follow us on X.
If you like what we're doing, please forward us to a friend. If you're not already subscribed, join our growing family of free subscribers.
Reply