- The Range
- Posts
- How to Use This Newsletter
How to Use This Newsletter

In a hurry?🏃♀️➡️ Click on any of these jump links to take you to where you want to go:
What Problem Does The Range Solve?
The flow of information has grown to dizzying levels.
Whether it be from social media or legacy financial news outlets, posts and headlines are designed to trigger an emotional response that often causes investors to either overreact or freeze with indecision.
While there’s no shortage of newsletters that do a great job of curating and lending entertainment value to the week’s top news stories, none give any perspective on how much the stock market is expected to move in response to the upcoming week’s events.
That is, until now!🙌🙌
The Range was created by a former Wall Street strategist who left the industry to pursue a more creative outlet for his data storytelling obsession.
After 20 years of helping some of the most sophisticated traders and hedge fund managers make money, one of the most important lessons learned is that volatility and positioning are what shape the market’s day-to-day ranges, not news.
We’ve worked hard to make this newsletter intuitive so that you enjoy learning about how markets really work.
The Range uses easy-to-digest data storytelling to inform readers about how, for the large majority of the time, volatility expectations and positioning are likely to shape the week’s price limits, no matter how many breaking news stories occur.
Readers will also benefit from the value-packed insights that are curated from the social media accounts of Wall Street’s top players to help show what they are seeing that could affect the market’s larger trends. We only highlight research that is built on rigor and is not meant to generate FOMO (fear of missing out).
How to Use Our Charts
What is Volatility?
Ooooh, volatility is such a big, scary word, right?😱
Wrong.
If you are to become a successful trader, you must learn to “become one” with volatility.🧘♀️
Volatility is simply the short or long-term (whichever timeframe you view markets in as an investor) price swings that a stock’s price undergoes.
What are the Types of Volatility?
Volatility comes in two forms:
Implied volatility (also known as expected volatility) is the future outlook for volatility.
Historical volatility (also known as realized volatility) is backward looking and looks at the stock price movement that has already occurred.
To help provide perspective, The Range utilizes both forms of volatility.
How Does This Newsletter Utilize Implied Volatility?
At the start of every newsletter, readers will find a chart similar to Figure 1 below.
Figure 1
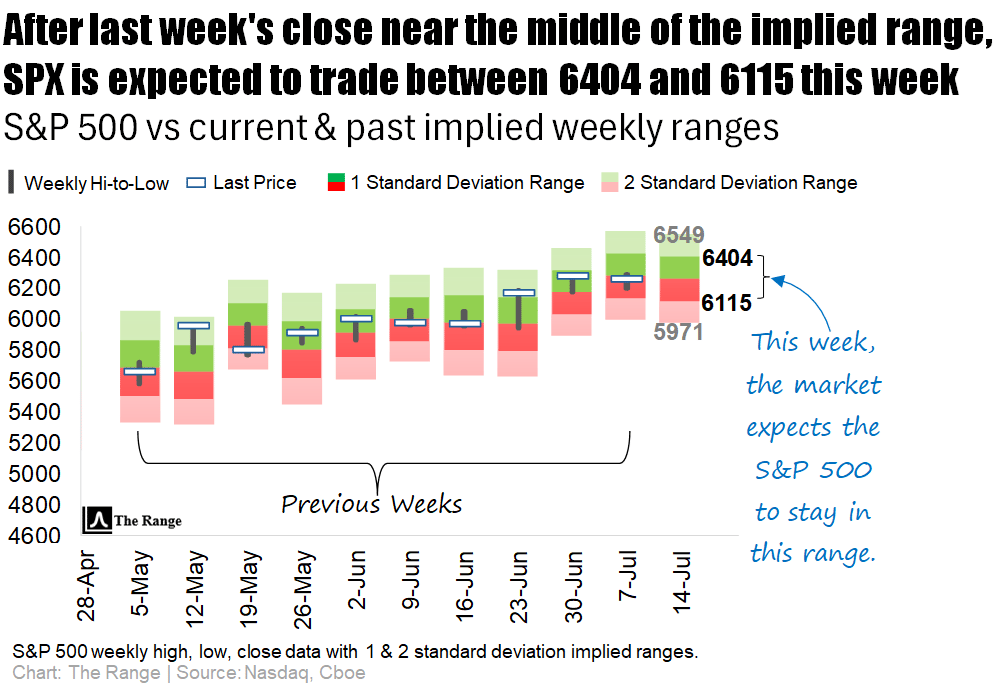
The red and green shaded areas are the centerpiece of the newsletter, because they show the expected move for the S&P 500 over the upcoming week (extreme right hand side of the chart). The chart also shows where the S&P 500 traded in relation to its expected range over the 10 previous weeks.
What Is the Expected Move and How Is it Calculated?
The expected move is an estimate of how much a security’s (e.g., stock, ETF, index, etc.) price might move.
There are three variables that make up the expected move formula:
The security’s current price
The security’s implied volatility
The desired expected move period (1 day ahead, 5 days ahead, 1 month ahead, etc.)
Lucky for all of us, implied volatility is one of several complex formulas that are conveniently calculated by market makers when they set the price of options contracts.☘️
Market makers are financial entities or individuals whose job it is to actively provide liquidity to financial markets by continuously offering to buy and sell a particular asset, such as stocks, bonds, options, or currencies.
Using Implied Volatility to Calculate the Market’s Expected Move
Here’s an example:
Let’s say the S&P 500 closes at 6,000 on a Monday and the 1-day implied volatility heading into Tuesday’s trading session is 1.0%.
This means that the market makers, taking into account all the recent news that has been made public, along with any information (earnings, economic data, etc.) that is expected on Tuesday, expect the S&P 500 to move either up or down by 1.0%.
Therefore, the expected range for Tuesday’s session is between 6,060 and 5,940.
6,000 x 1.0% = 60
6,000 + 60 = 6,060
6,000 – 60 = 5,940
Statistically, the expected move predicts the market’s future price movement with 68% certainty (one standard deviation).
On the chart above (Figure 1), you’ll find this 68% probability range presented in dark green and red shading.
While the expected move does not successfully predict the upcoming range all of the time, a security will trade within this expected range most of the time.
For those rare instances when volatility expands beyond expectations, our chart also plots the 2 standard deviation range, which predicts 95% of future price movement.
This range is represented by the light green and red area on Figure 1 above.
How Does This Newsletter Use Historical Volatility?
For historical perspective, The Range highlights the S&P 500’s year-to-date (YTD) performance on each day of the week.
This is useful for a couple of reasons:
It helps you to understand the percentage moves that occur most often.
It helps you set expectations for the extreme price moves that are likely NOT going to occur.
Let’s take a closer look at what this means.
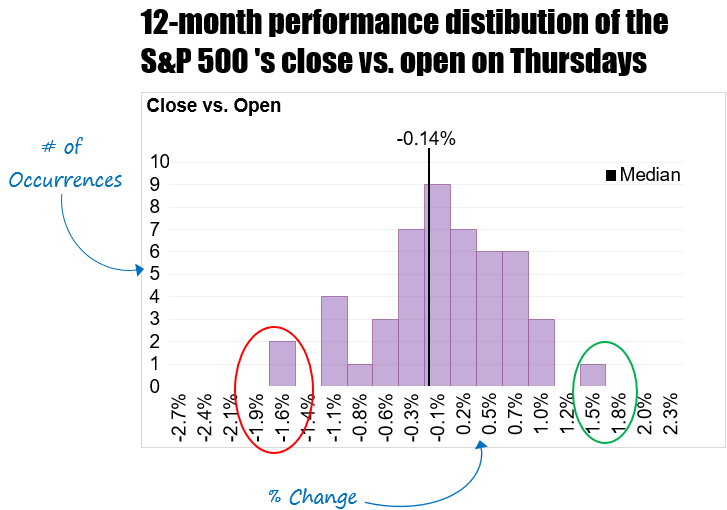
The next graph (Figure 2) shown below is an example of the historical volatility charts shown in our daily newsletter.
Figure 2 shows the performance distribution of the opening price to the closing price for the S&P 500 on Thursdays over the Y-T-D period.
It also explains that the median percentage change (black line) was slightly negative (-0.14%) at the time this chart was created.
In addition, you can see that the two largest declines fell between -1.6% and -1.9% (see red circle) and the largest rally was between 1.5% and 1.8% (see green circle), helping to provide you with an understanding moves outside of these extremes are likely to NOT occur on Thursdays.
Figure 2
Now You’re in Control
Quite honestly, there are a few different directions this closing section can go.
Like so many things in both business and in life, however, there really is no need to make it any more complex than it needs to be.👍
Our goal is to build this newsletter into a trusted brand that informs and entertains as well as popular pioneers like Morning Brew, but with the BIG value-add of actually providing you with an understanding of how all of the news fits within the market’s plan.
The Range is ideal for anyone who enjoys easily digestible, carefully curated news that is accompanied by interesting data visualizations and valuable market insights.
The inspiration for this newsletter comes from many years of learning how markets work, and the sense of peace that was achieved once that moment was reached.
This newsletter does not give a view on market direction.
The Range only delivers perspective about how markets tend to swing (historically) and what implied volatility is saying about the potential future path, so that you feel more in control of a world FILLED with headlines.
If the market’s moving in a big way, use our historical and forward-looking (implied) charts to understand if the move is nearing its limits or if the potential exists for it to run.
Will there be times when markets move more than expected? Absolutely.
However, these instances are not the norm and we’ll focus on informing you when the potential for such anomalies exists.
Reply