- The Range
- Posts
- This Holiday-Shortened Week Packs a Punch
This Holiday-Shortened Week Packs a Punch
Even with shortened hours, traders face a packed slate of data, volatility signals, and seasonal market patterns.
👋Hello and Happy Monday! 🌅
Here’s what’s on deck this holiday-shortened week:
Thanksgiving week brings a packed economic lineup despite market closures
John Deere, Dell, Alibaba headline a condensed earnings buffet
Seasonal patterns, especially when trend-adjusted, show a bullish edge for the week ahead
The S&P 500 has closed within its implied range in 9 of the past 10 weeks
Let’s do this!💪💪

🛌Markets will hit snooze for Thanksgiving, but much-anticipated data will be flowing this week
The stock and bond markets are taking Thursday off to honor Thanksgiving (and hopefully a well-deserved food coma). But don’t let the holiday vibes fool you — the economic calendar is still serving up plenty of hot dishes.
We’re talking retail sales (finally), jobless claims, pending home sales, durable-goods orders, and a fresh consumer-confidence read. Some government reports will still be fashionably late as agencies scramble to catch up after the shutdown, but the core lineup is locked in.
Oh, and markets will close early Friday — stocks ring the bell at 1 p.m. ET, bonds at 2 p.m. ET — so traders can sprint to leftover turkey sandwiches.
💵What’s the market pricing in for the week ahead?
Even after last week’s wild swings, the benchmark S&P 500 closed within its expected/implied 5-day range for the 9th time in 10 weeks.
Here’s what’s expected this week:
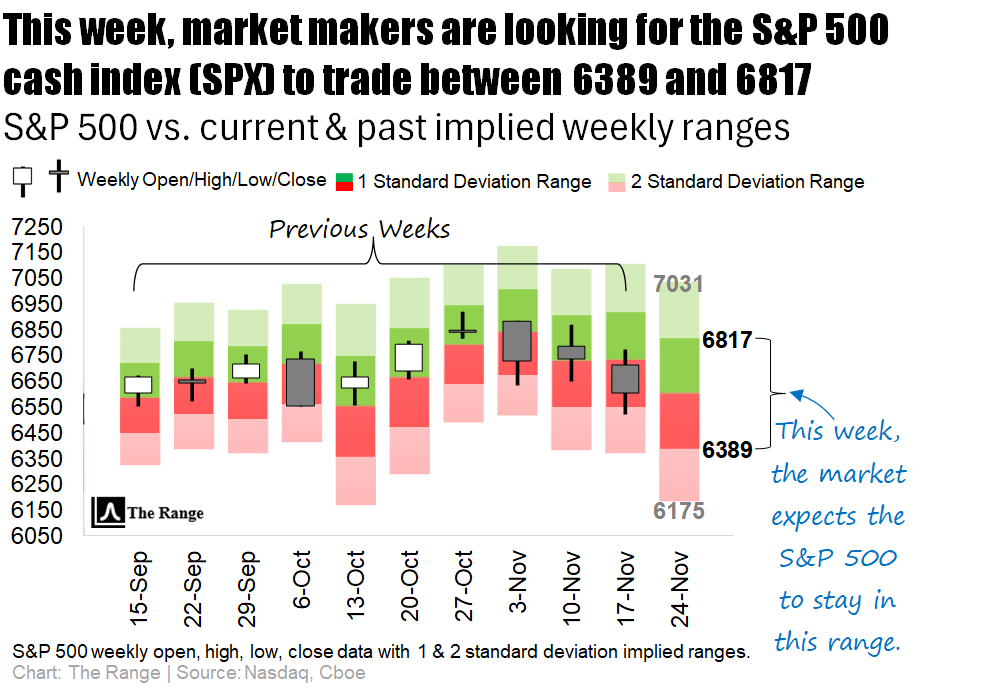
ℹ️ WHY IS THIS IMPORTANT?
For both stock and options traders: Knowing what the implied weekly range is helps set expectations for what the likely trading limits will be. This can help prevent overreaction near quantified range extremes, while also informing the traders on whether there is still room for an intra-week rally or sell-off to run.
📝 Note: This same logic can also be applied to the “Where’s the Action At?” section below.
Click here 👈 to learn more about our charts.

John Deere, Dell, Alibaba headline a condensed earnings buffet
Monday kicks off with Agilent, Zoom, and Symbotic — the Walmart-partnered robotics company that’s basically building the AI-powered warehouse of the future.
Then comes Tuesday’s rush-hour earnings jam: Alibaba, Applied Digital, Autodesk, NetApp, and cybersecurity heavyweight Zscaler. Workday will also report for the first time since Elliott Investment Management showed up with activist energy and a not-so-subtle stake.
Later that day, Dell and HP step into the spotlight fresh off analyst downgrades tied to rising component costs — not exactly the glowing pre-earnings warmup they were hoping for.
And on Wednesday, John Deere will roll in with results that double as a pulse check on the construction and agriculture economy.
🤔 Which companies are poised to possibly over- or underreact to earnings this week?
Over the past 12 quarters, this week’s largest reporting company (Alibaba) has shown a tendency to move outside of the market makers’ expected range during the trading session immediately following earnings (keep reading below the next table for more details on how this is calculated).
Of the 20 largest companies reporting earnings this week, Dell Technologies has the most history of moving more than the market expects during the trading session immediately following earnings.
Conversely, of the top 20 companies reporting this week, BHP Group has a very strong history of staying inside its post-earnings expected range (keep reading below the next table for more details).
👇 Below is a look at this week’s biggest earnings reports, sorted by market cap:
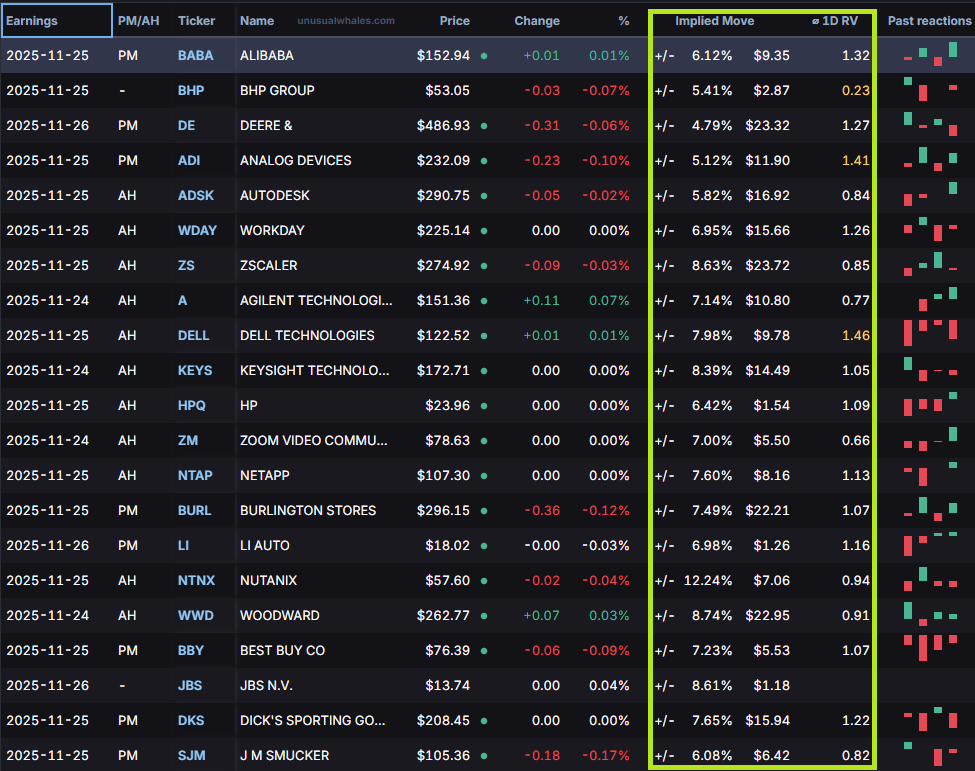
HOW CAN TRADERS USE THIS INFORMATION?
For active traders looking for actionable insights, the highlighted columns on the table above show the implied (expected) post-earnings move for each company, along with the Average 1-Day Realized Volatility Post-Earnings Ratio (1D RV).
📈Implied Move: The market’s best guess at how much a stock will swing after earnings.
📊1D RV: A powerful tool that represents the post-earnings price move divided by the expected price move over the past 12 quarters. In other words, it measures how good (or bad) the market is at pricing each company’s earnings.
💵When you see a ratio >1.0, it indicates that, historically, the earnings are mispriced and the stock moves MORE than the market anticipates, favoring straddle buyers.
🪝A ratio <1.0 tells the opposite story, meaning the stock historically moves LESS than the market anticipates, which favors straddle sellers.
Happy hunting.

Thanksgiving week doesn’t just mark the start of holiday chaos and questionable casserole choices—it also kicks off one of the market’s most reliable seasonal sugar highs.
Historically, the S&P 500 treats Thanksgiving like its own personal cheat week. Since the S&P 500’s inception in 1957, the index has finished the week in the green 69% of the time, with a chill-but-respectable average and median returns of 0.6% and 0.8%, respectively.
And if you’re hunting for the week’s MVP, look no further than the Wednesday before Turkey Day—a day that has historically blown every other session out of the cranberry sauce with a 76.5% win rate.

Right around 1986, however, things started to cool off slightly, mainly because Wednesdays were freakishly positive for 22 straight years.
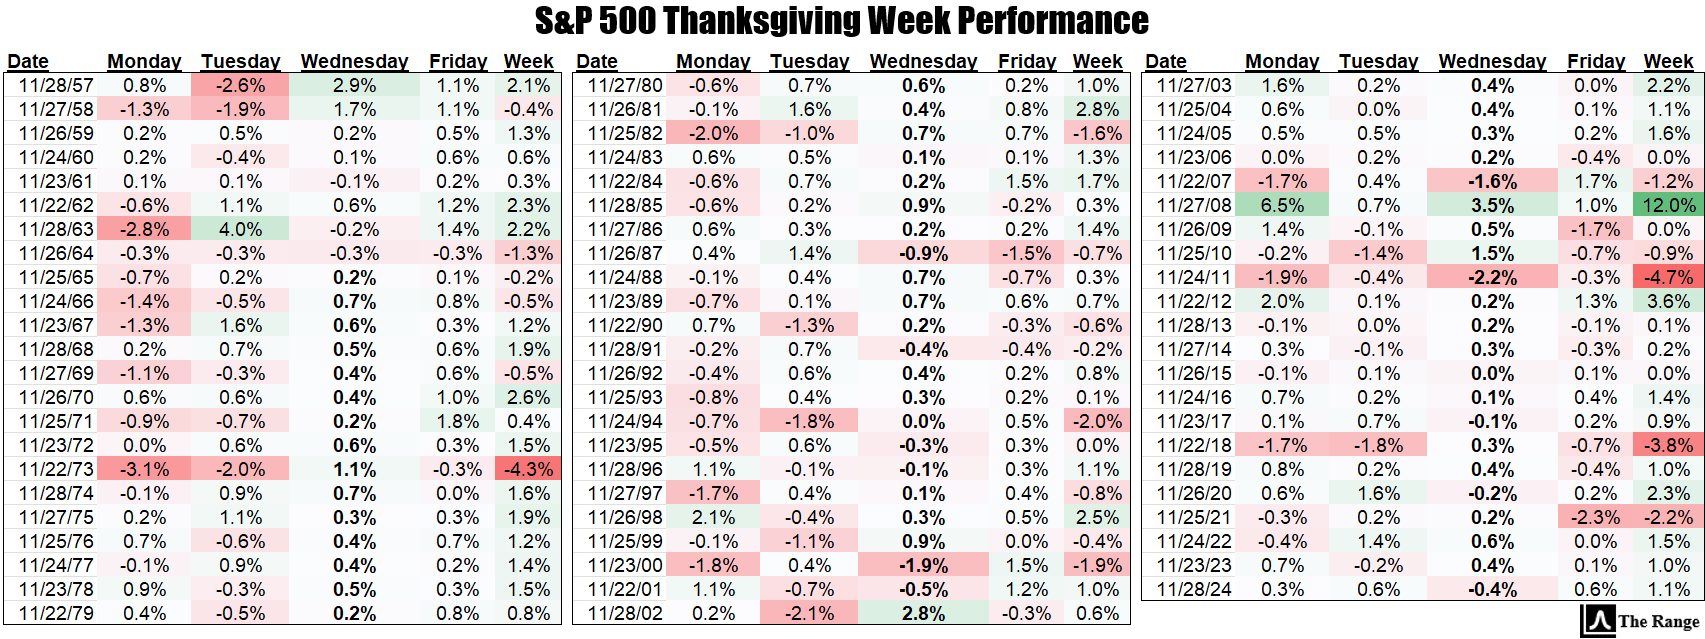
Keep in mind; these stats are compiled from all years, under all trend conditions.
So what happens if we narrow it down to years when trend conditions look like what we’re witnessing right now? In other words, years when the S&P 500 enters Thanksgiving week in a bull-market correction—below a falling 21-day EMA but still above a rising 200-day SMA?
Short answer: Tuesday, Wednesday, and Thursday look even better for the bulls… but the full week gets less festive. And Monday? Let’s just say the performance drop-off is more brutal than the 3 p.m. tryptophan crash.


📉 JPMorgan, Citi, Morgan Stanley client data may be exposed by vendor’s hack, NYT reports: A November 12 cyberattack on real estate tech vendor SitusAMC may have compromised sensitive client files (like accounting docs and legal contracts) for big banks like JPMorgan, Citi, and Morgan Stanley — though the breach has been contained and no major service disruption has been reported. Read more
🤖 Stargate’s AI Strategy: Safeguarding the Nation or Raising Antitrust Concerns?: Bitget reports that a $500 billion AI infrastructure venture led by OpenAI, Nvidia, and Oracle could consolidate too much power — drawing fire from a Yale scholar who warns it could function like a cartel. Read more
🛍️ Top scams targeting shoppers this holiday season: Cybersecurity experts warn buyers of a surge in AI-powered scams this holiday — from lookalike online stores to deepfake celebrity ads, phishing, and shipping texts, all designed to separate you from your cash. Read more

Gif by PudgyMemez on Giphy
💼 Bessent says ‘detox’ period for economy does not have to be a recession: Treasury Secretary Scott Bessent argues that while the U.S. economy may be going through a transition as spending is cut, it doesn’t necessarily mean a full-on recession is coming. Read more
🧠 After 60 Years, Diabetes Drug Found to Unexpectedly Impact The Brain: A new study suggests metformin — the decades-old diabetes drug — may work not just in the liver and gut, but also by acting directly in the brain, potentially opening doors for next-gen treatments. Read more

Once again, technology (XLK) is expected to be the most volatile sector this week. Also showing high implied volatility is the consumer cyclicals sector (XLY), which replaces basic materials (XLB) for the second highest volatility range. Lastly, the energy sector (XLE) maintains its spot as the sector with the third highest implied volatility.
At the opposite end of the spectrum, the consumer staples (XLP) sector has replaced the utilities sector (XLU) as one of the three sectors expected to witness the lowest volatility. The other two sectors, communications (XLC) and healthcare (XLV), are stayovers from last week.

ℹ️ WHY IS THIS IMPORTANT?
For options traders in particular: Implied volatility sets the tone for option prices. Understanding where large or small implied moves are priced in helps traders decide whether options are over- or under-valued before placing trades.

Monday
Top Earnings: Agilent, Symbotic, Keysight Technology, Zoom Communications
Tuesday
U.S. retail sales, Producer Price Index, Business inventories, S&P Case-Shiller home price index, Consumer confidence, Pending home sales
Top Earnings: Alibaba, Analog Devices, Dell Technologies, Autodesk, Workday, Zscaler, NetApp, HP, NIO
Wednesday
Initial jobless claims, Federal Reserve Beige Book, Durable-goods orders, Chicago Business Barometer PMI
Top Earnings: Deere & Co., Li Auto
Thursday
Thanksgiving (markets closed)
Friday
Stock markets close at 1 p.m. ET; Bond markets close at 2 p.m. ET

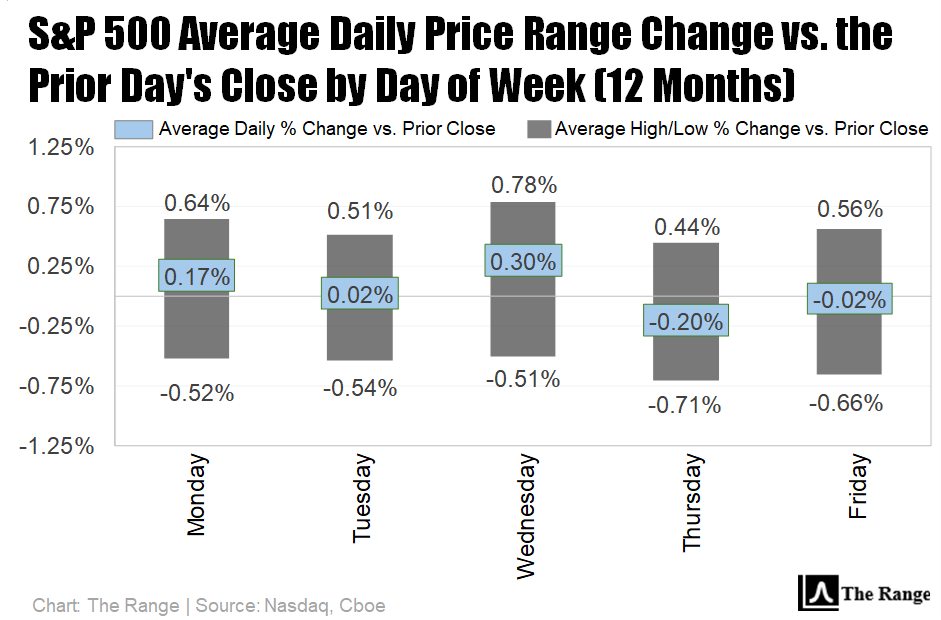
After we warned that the CBOE Volatility Index’s (VIX) upward trend heading into last week could set the stage for wild swings outside of the daily norms, the market did not disappoint.
For this week, many market experts are expecting volatility to compress from last week’s elevated levels. While this would lead to the S&P 500 trading closer to the historic averages revealed by this next chart, the gradual liquidity fade that will occur as more and more participants sign off for the holiday could theoretically lead to some wider than usual intra-day swings.
📝 EDITOR’S NOTE
Each day the market is open, we update our comprehensive performance charts on our website for you to view. In addition, be sure to follow us on X for timely intra-week updates.

📋Here’s a curated list of top value-added insights that uncover what’s happening way beyond the usual financial media headlines.

Please be sure to follow us on X.
If you like what we're doing, please forward us to a friend. If you're not already subscribed, join our growing family of free subscribers.
Reply