- The Range
- Posts
- The S&P Rarely Sees 1-Day Drops Like Friday's From Such Heights
The S&P Rarely Sees 1-Day Drops Like Friday's From Such Heights
Friday’s 2.7% drop was one for the statistical history books—literally
👋Hello and Happy Monday! 🌅
Here’s what’s on deck this week:
📉 History’s Not Cooperating: If you’re hunting for historical parallels to Friday’s 2.7% post–all-time high selloff, good luck.
🏛️ Shutdown Snag: A lingering federal shutdown could delay key economic data releases.
💰Earnings Parade: Big banks like J.P. Morgan Chase, Wells Fargo, and Goldman Sachs report earnings this week, along with key updates from TSMC, Johnson & Johnson, and American Express.
📅Holiday Note: Bond markets closed Monday for Columbus Day; stocks and exchanges stay open. The Fed, major banks, and many government offices will also be closed.
Let’s get going.▶️▶️

💵What’s the market pricing for the week?
Markets are still nursing a hangover from Friday’s selloff after President Trump lobbed higher tariffs back at China in response to its rare earth export curbs.
Last week’s 2.43% decline was the S&P’s largest since the 3rd week of May. Though by a trivial measure, it was also the first time in 10 weeks that the benchmark index closed outside its implied weekly range.
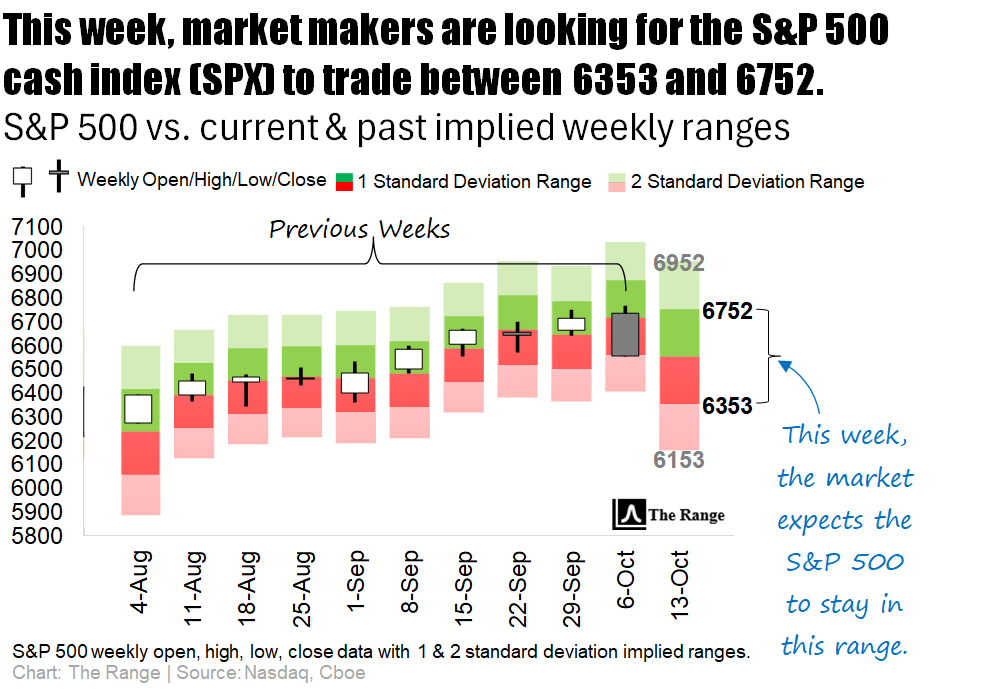
As a result, Investors are bracing for the next plot twist in trade policy — though let’s be honest, there’s always the chance Trump will TACO (Trump Always Chickens Out) his own tariff talk if weakness persists. 🌮
Meanwhile, the federal government shutdown is dragging into week three, threatening to delay key economic reports. Still, earnings season marches on: J.P. Morgan Chase, Wells Fargo, Goldman Sachs, and AmEx headline a jam-packed week that also features TSMC, Johnson & Johnson, and United Airlines. The Fed’s Powell is scheduled to speak — assuming he can find a government office that’s still open.
Click here 👈to learn more about our charts.

It’s Big Bank Week on Wall Street. 💰 J.P. Morgan Chase kicks things off Tuesday, with investors watching whether Jamie Dimon’s “economic turbulence” warning hits the bottom line. The world’s largest bank by market cap has beaten revenue expectations so far this year, but cracks showed last quarter as sales dipped and net interest income slipped.
Joining the party: Wells Fargo, Goldman Sachs, BlackRock, and Citigroup also report Tuesday, followed by BofA and Morgan Stanley on Wednesday. Later in the week, Charles Schwab, BNY Mellon, U.S. Bancorp, AmEx, Truist, and State Street will spill their Q3 tea.
Meanwhile in chipland, TSMC reports Thursday after a 40% revenue surge powered by AI demand. ASML drops results Wednesday, but the Dutch giant has already hinted that tariffs might rain on its semiconductor parade. ⚡
🤔Which companies are poised to possibly over/underreact to earnings this week?
Based on the stock’s previous post-earnings responses, shares of this week’s biggest reporting company (Taiwan Semiconductor) have shown a tendency to move beyond the implied range following earnings (keep reading below the next table for more details on how this is calculated).
At the opposite end of the spectrum, of the top companies reporting this week, Bank of America has shown a tendency to remain within its post-earnings expected range (keep reading below the next table for more details).
👇 Below, is a look at this week’s biggest earnings reports, sorted by market cap.
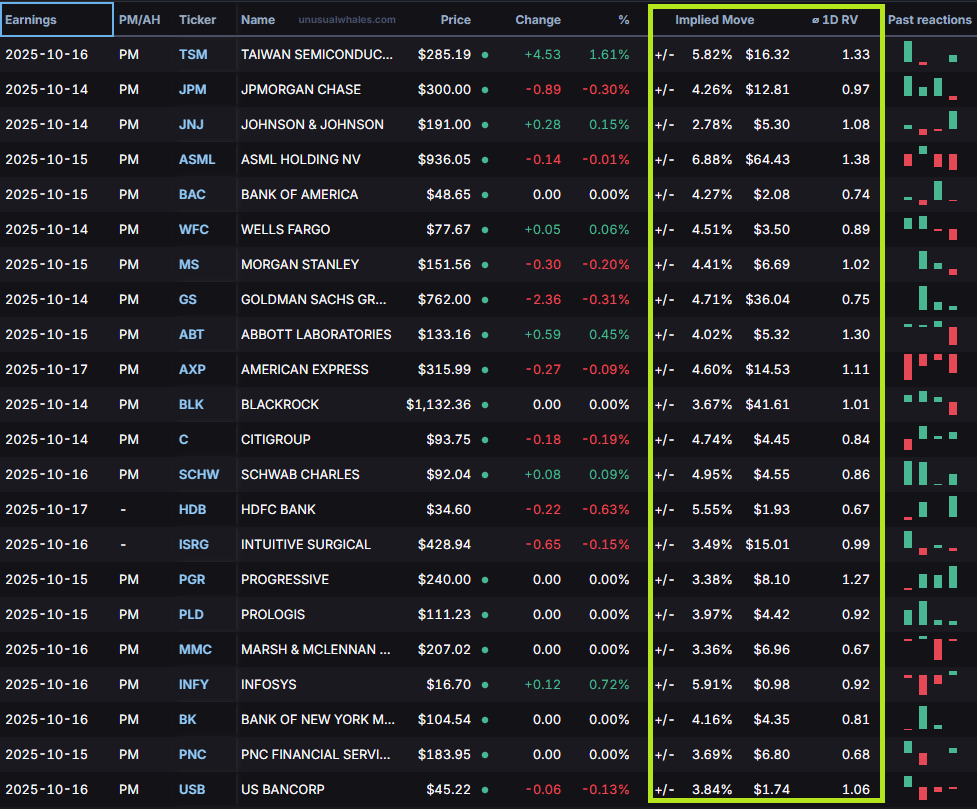
Source: Unusual Whales
For active traders looking for actionable insights, the highlighted columns on the table above show the implied (expected) post-earnings move for each company, along with the Average 1-Day Realized Volatility Post Earnings Ratio (1D RV).
📈Implied Move: The market’s best guess at how much a stock will swing after earnings.
📊1D RV: A powerful tool that represents the post-earnings price move divided by the expected price move over the past 12 quarters. In other words, it measures how good (or bad) the market is at pricing each company’s earnings.
💵When you see a ratio >1.0, indicates that, historically, the earnings are mispriced and the stock moves MORE than the market anticipates, favoring straddle buyers.
🪝A ratio <1.0 tells the opposite story, meaning the stock historically moves LESS than the market anticipates, which favors straddle sellers.
Happy hunting.

Note: This section offers a sneak peak into a new premium Substack product that we plan to launch soon.
History Shrugs: When the Market Falls from Rare Air
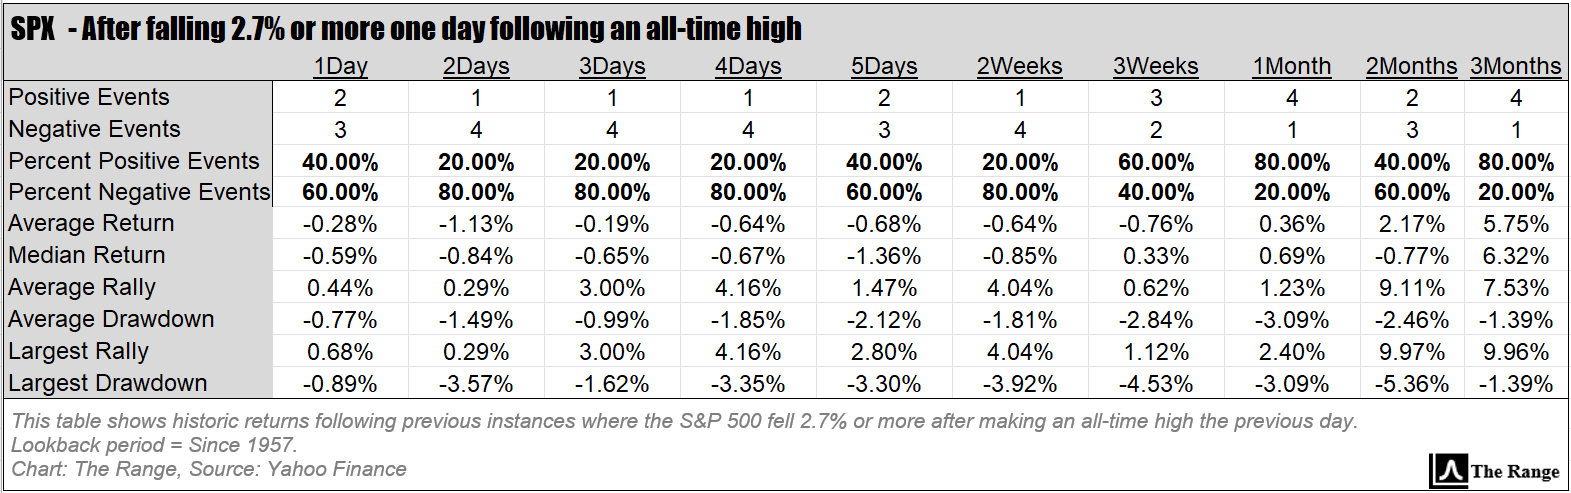
If you’re hunting for a robust dataset to make sense of Friday’s faceplant… good luck. Since 1957, there have been exactly three instances where the S&P 500 dropped 2.7%+ just a day after hitting fresh all-time highs—while sitting more than 11% above its trusty 200-day moving average. Statistically speaking, that’s about as rare as a Fed chair admitting they were wrong.
In fact, the S&P has only spent 13% of its sessions since ’57 floating that far above its 200-DMA, so a little mean reversion was basically overdue. We even tried loosening the filters—2.5%, 2.0%, anything to give the quant crowd something to chew on—but the data still gave us a shrug.
We even looked at what the market did following a decline of 2.7% or more after making an all-time high at any percentage above the 200-DMA. Those five previous results, though NOT statistically robust, are shown on the first table below, given the importance of this development.
Here’s where these events reside on the long-term chart:
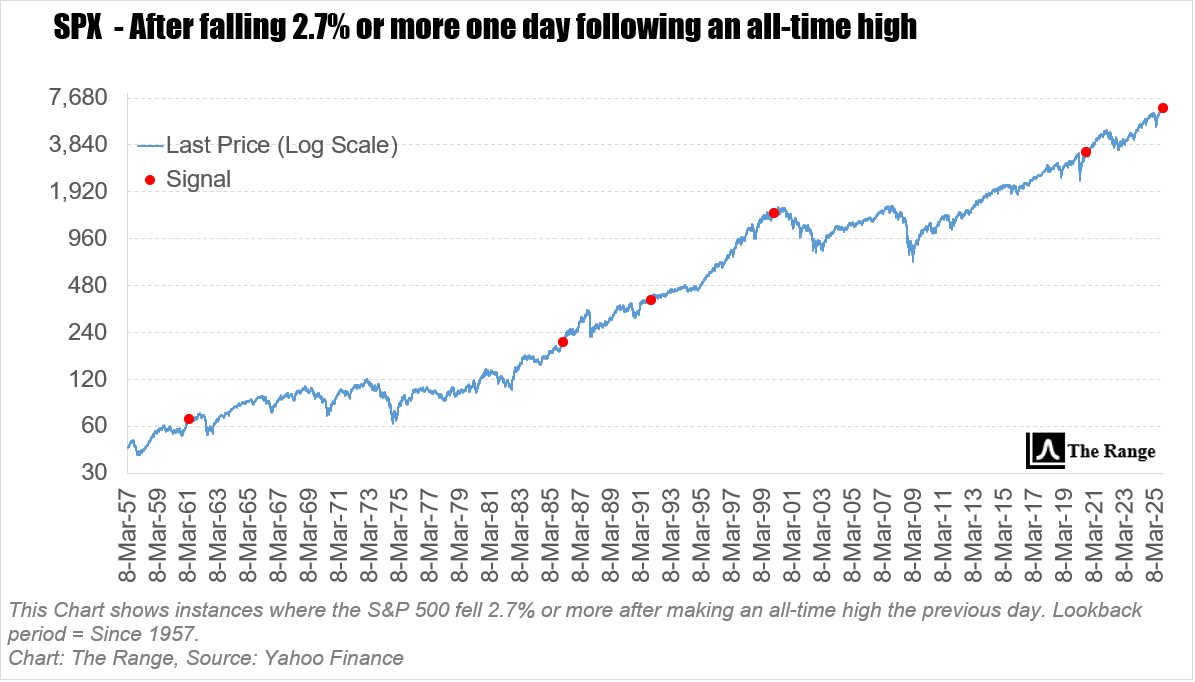
.
Armed with the knowledge that the conditions surrounding Friday’s sell-off were just so darn rare, we resorted to using a tried-and-true monthly trading signal.
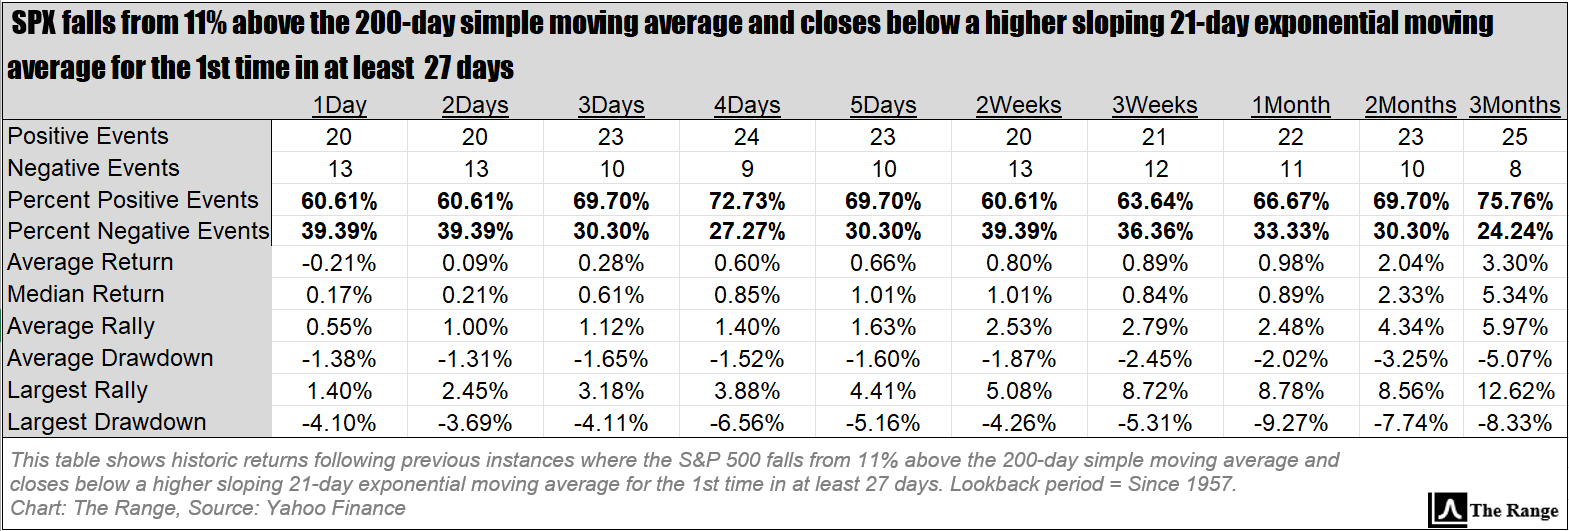
This next table shows a more robust performance set following previous instances where the S&P 500 fell from 11% above the 200-day simple moving average and closed below a higher sloping 21-day exponential moving average for the 1st time in at least 27 days, just like it did on Friday.
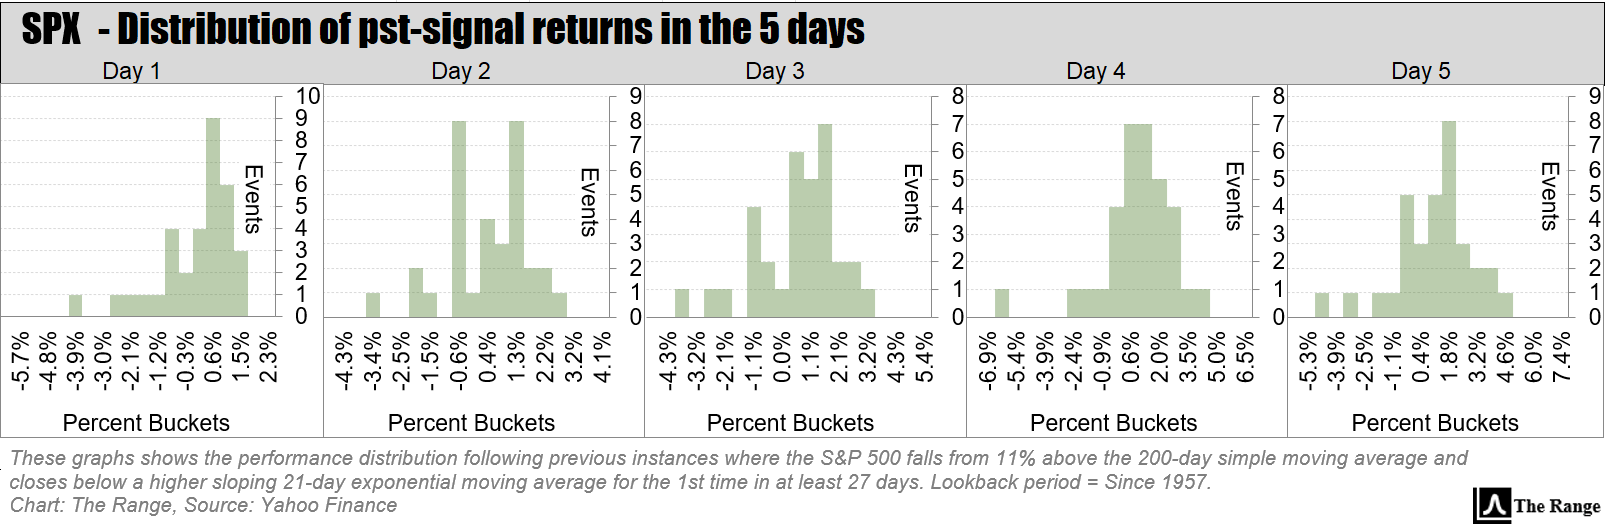
The distribution of these returns over the next 5 trading days can be seen here:
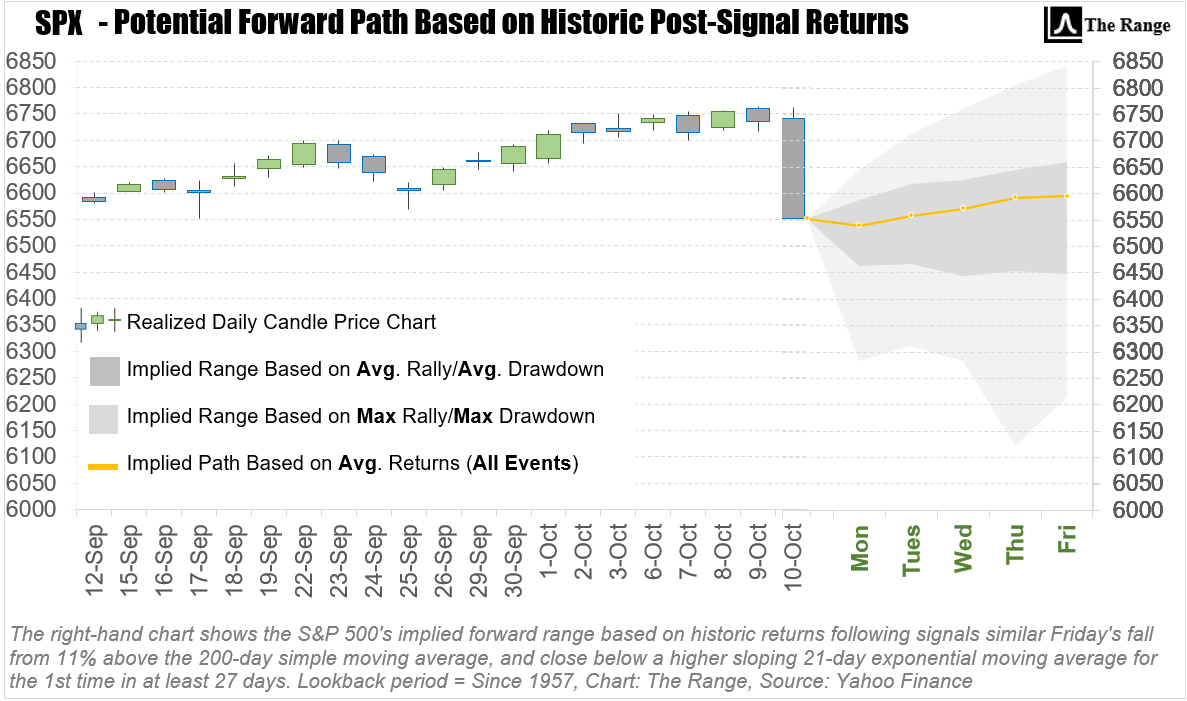
Finally, a visualization of a potential path forward for the week ahead based on these results is show here.
.
Good luck out there! 🍀🍀

🏦 Wall Street’s biggest banks are riding high as earnings season begins: America’s banking giants are kicking off earnings season like it’s the Met Gala, flaunting big profits, fat trading wins, and just a hint of “we told you rates were fine.” Read more
💻 Qantas says customer data released by cyber criminals months after cyber breach: Months after claiming a cyber incident was contained, Qantas is eating humble pie as hackers just dropped customer data online—apparently proving “secure” doesn’t always mean “safe.” Read more
🧪China defends rare earth export limits as legitimate, hits back at US tariffs ahead of possible Trump-Xi meeting: China basically told the U.S. to stop whining about its rare earth restrictions, calling them “perfectly legal” while hinting that any Trump-Xi meeting might need a detox first. Read more

💸 First Brands creditor says $2.3 billion ‘simply vanished,’ seeks probe: A creditor is crying foul after discovering that $2.3 billion from auto parts maker First Brands seems to have Houdini’d out of existence—sparking a push for an investigation and some serious forensic accounting. Read more
🎰 Casino license final decision near for Citi Field, Resorts World: The battle for New York’s casino crown is down to the wire as regulators prepare to deal the final hand—one that could turn Citi Field into Sin City East or keep Resorts World on top. Read more

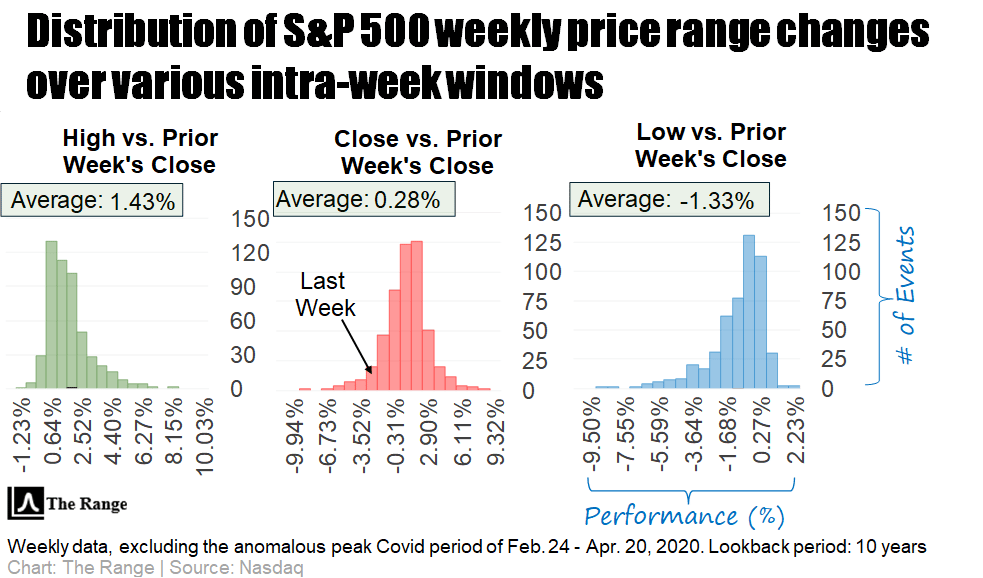
With the CBOE Volatility Index - VIX closing above the key 20 level and hitting levels not seen since mid-June on Friday, the S&P 500’s weekly returns are once again at risk of spreading beyond normal distribution.
ℹ️ WHY THIS MATTERS
When markets turn unusually volatile, the potential for panic to take over increases because traders are not informed about what’s normal. One of the best ways to remain in control during periods of heightened volatility is to put them into context.
Click here 👈to learn more about our charts.

.
Let’s put the S&P 500’s unusually high volatility on Friday into perspective. The way we view normal volatility on a near-term basis is to look at the S&P’s average true range (ATR) over a rolling 21-day (one month of trading) period. Therefore, any movement within a 21-day ATR range is considered normal. Friday’s decline measured a very rare 4x the 21-day ATR. 🫨
Given this outsized weakness, as well as the aforementioned VIX spike, this week’s early action is at risk of extending beyond the average moves witnessed over the past 12 months.
📝 EDITOR’S NOTE
Each day the market is open, we update our comprehensive daily performance charts on our website for you to view. In addition, be sure to follow us on X for timely intra-week updates.

Monday
Columbus Day holiday: bond markets, banks closed; stock markets open
Federal Reserve Officials Speaking: Philadelphia Fed President Anna Paulson
Oracle AI World conference begins
Top Earnings: Fastenal
Tuesday
NFIB small business optimism index (September)
Federal Reserve Officials Speaking: Fed Chair Jerome Powell, Fed Vice Chair Michelle Bowman, Fed Governor Christopher Waller, Boston Fed President Susan Collins
Salesforce Dreamforce conference begins
Top Earnings: J.P. Morgan Chase, Johnson & Johnson, Wells Fargo, Goldman Sachs, BlackRock, Ericsson, Domino’s Pizza, Albertsons
Wednesday
Federal Reserve Beige Book
More Data to Watch: Empire State manufacturing survey (October)
Federal Reserve Officials Speaking: Fed Governor Stephen Miran, Fed Governor Christopher Waller, Atlanta Fed President Raphael Bostic
Top Earnings: ASML, Bank of America, Morgan Stanley, Abbott Laboratories, Prologis, PNC Financial, United Airlines
Thursday
Homebuilder confidence (October)
Data Delayed by the Shutdown: U.S. retail sales (September), Producer Price Index (PPI) (September), Initial jobless claims (Week ending Oct. 11), Business inventories (August)
Federal Reserve Officials Speaking: Fed Governor Stephen Miran, Fed Governor Christopher Waller, Fed Governor Michael Barr, Fed Vice Chair Michelle Bowman
More Data to Watch: Philadelphia Fed manufacturing survey (October)
Top Earnings: TSMC, Charles Schwab, Interactive Brokers, Bank of New York Mellon, U.S. Bancorp, CSX Corp, Travelers
Friday
Industrial production & capacity utilization (September)
Data Delayed by the Shutdown: Housing starts (September), building permits (September), import price index (September)
Top Earnings: American Express, Truist Financial, State Street, Fifth Third Bancorp, Huntington Bancshares, Regions Financial

Below is our curated list of top value-added insights that uncover what’s happening way beyond the usual financial media headlines.
Gold and stocks almost never rally at the same time but that's what's happening now.
One is a hedge and the other is an optimistic bet. But the market is so strong right now investors are treating gold as a way to diversify their optimism. Totally counter to history.
— Phil Rosen (@philrosenn)
1:46 PM • Oct 10, 2025
The median S&P 500 stock is in a 15% drawdown
— Mike Zaccardi, CFA, CMT 🍖 (@MikeZaccardi)
1:56 PM • Oct 11, 2025
Prediction Markets calling Trump's bluff.
Only 23% chance on Polymarket that there will actually be a 100% tariff on China by November 1st.
— Easy (@EasyEatsBodega)
1:36 PM • Oct 11, 2025
We buyers of this tech sell off. 🔥🏆🐂🎯🇺🇸🇨🇳👇
— Dan Ives (@DivesTech)
7:41 PM • Oct 10, 2025
📈 China’s Broad Money Supply Surpasses Combined U.S. and EU Since 2023
In September 2023, China’s broad money supply reached $39.7 trillion, overtaking the combined total of the U.S. and EU at the $39.6 trillion. By August 2025, China’s broad money supply had climbed to $46.3
— Econovis (@econovisuals)
12:30 PM • Sep 25, 2025

Please be sure to follow us on X.
If you like what we're doing, please forward us to a friend. If you're not already subscribed, join our growing family of free subscribers.
Reply