- The Range
- Posts
- Retail Booms, Bulls Charge, and Powell Grabs the Mic: Welcome to December
Retail Booms, Bulls Charge, and Powell Grabs the Mic: Welcome to December
Retail strength and a refreshed S&P 500 set the stage for year-end optimism.
👋Hello and Welcome to Monday! 🌅
Here’s what we’re watching this week:
Stocks rally into Thanksgiving, but a data-heavy week now hits the calendar.
Private payrolls take center stage as the official jobs report stays delayed.
Big tech and dollar stores report, offering clues on spending and enterprise demand.
The VIX has now fallen so rapidly that a reflexive up-tick in volatility may be in the cards early this week.
Bulls are leaning on December seasonals to help their case through year-end.
Let’s jump in!🦘🦘🦘

Cyber Monday splurge & fresh sentiment data put consumers in the hot seat
Retailers are stepping back into the spotlight this week as consumers wrap up their annual five-day shopping marathon. Salesforce expects online spending from Thanksgiving through Cyber Monday to hit a hefty $78 billion, giving retailers a much-needed sugar rush heading into December.
And we’ll get a clearer picture of how shoppers feel about all that spending soon. Friday brings the first December read of the University of Michigan’s consumer sentiment index, followed later in the day by the Fed’s consumer credit report—aka a peek at how much debt Americans are racking up to fund those holiday carts.
We’ll also see fresh private payroll data, but investors won’t get the official monthly jobs report until Dec. 16 thanks to the government shutdown delay. ADP’s update on Wednesday follows a surprisingly strong October print.
Meanwhile, Fed Chair Jerome Powell takes the mic Monday evening, just as Wall Street starts warming up to the idea of a rate cut at next week’s meeting.
💵What’s the market pricing in for the week ahead?
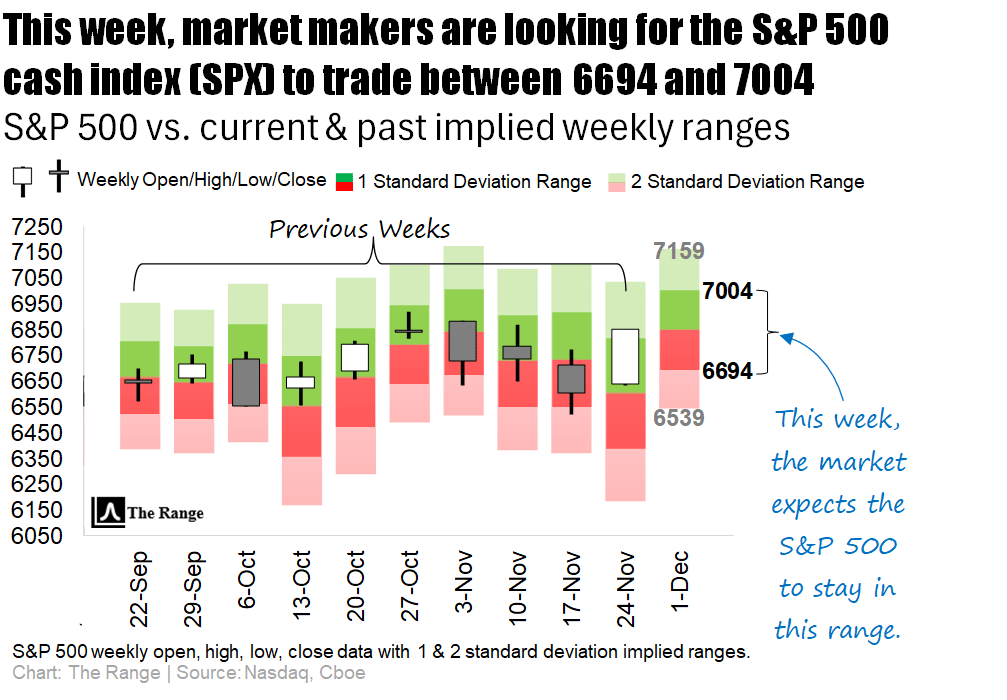
For the second time in 10 weeks, the S&P 500 closed outside the expected range set by market makers last week. And honestly, if there were ever a week for that to happen, it was during Thanksgiving’s annual liquidity coma.
Below is a look at what’s expected this week. Thanks to the recent plunge in the Cboe Volatility Index (VIX), the implied range has tightened up in a big way—yet it’s still uncommon for the S&P 500 to blow past expectations two weeks in a row.
ℹ️ WHY IS THIS IMPORTANT?
For both stock and options traders: Knowing what the implied weekly range is helps set expectations for what the likely trading limits will be. This can help prevent overreaction near quantified range extremes, while also informing the traders on whether there is still room for an intra-week rally or sell-off to run.
📝 Note: This same logic can also be applied to the “Where’s the Action At?” section below.
Click here 👈 to learn more about our charts.

Big software earnings & dollar-store checkups hit the tape
Earnings season isn’t done with us yet. Salesforce reports Wednesday, and after the company’s upbeat AI-driven revenue forecast last quarter, the Street is watching to see whether this train still has steam.
Marvell Technology, MongoDB, and Pure Storage also roll out results that could show how much AI demand is flowing into chips, databases, and storage.
Tuesday features cybersecurity heavyweight CrowdStrike, fresh off raising its full-year recurring-revenue outlook. Fellow security names Snowflake and Okta also report this week.
And if you want a read on lower-income consumer behavior, Dollar Tree and Dollar General will step up with earnings that may reveal how shoppers are trading down—or tapping out—this holiday season.
🤔 Which companies are poised to possibly over- or underreact to earnings this week?
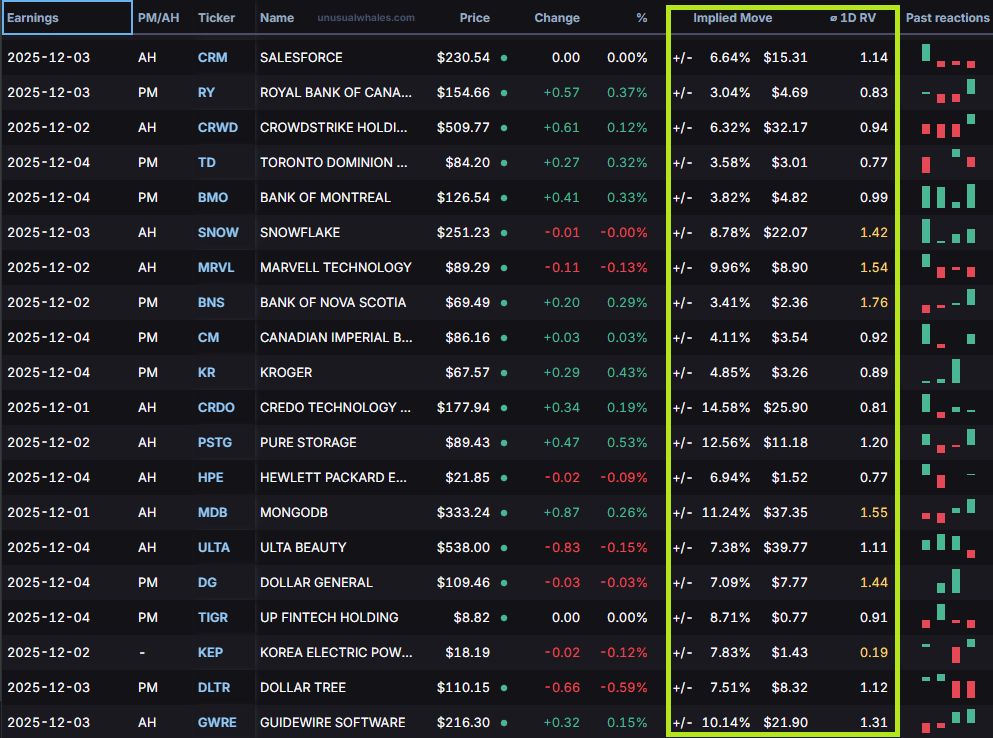
Salesforce, this week’s largest company to report earnings, has shown a tendency to move outside of the market makers’ expected range during the trading session immediately following earnings (keep reading below the next table for more details on how this is calculated).
Of the 20 largest companies reporting earnings this week, Bank of Nova Scotia has shown the greatest tendency to move more than the market expects during the trading session immediately following earnings.
At the opposite end of the spectrum, of the top 20 companies reporting this week, Korea Electric Power shows the greatest likelihood of staying inside its post-earnings expected ranges (keep reading below the next table for more details).
👇 Below is a look at this week’s biggest earnings reports, sorted by market cap:
HOW CAN TRADERS USE THIS INFORMATION?
For active traders looking for actionable insights, the highlighted columns on the table above show the implied (expected) post-earnings move for each company, along with the Average 1-Day Realized Volatility Post-Earnings Ratio (1D RV).
📈Implied Move: The market’s best guess at how much a stock will swing after earnings.
📊1D RV: A powerful tool that represents the post-earnings price move divided by the expected price move over the past 12 quarters. In other words, it measures how good (or bad) the market is at pricing each company’s earnings.
💵When you see a ratio >1.0, it indicates that, historically, the earnings are mispriced and the stock moves MORE than the market anticipates, favoring straddle buyers.
🪝A ratio <1.0 tells the opposite story, meaning the stock historically moves LESS than the market anticipates, which favors straddle sellers.
Happy hunting.

🏭 China’s factory activity shrinks again in November, services cool: China’s manufacturing PMI stayed below growth territory at 49.2 in November, while services slipped too — marking continued weakness in the world’s second-largest economy. Read more
🚗 General Motors makes a harsh decision as EVs falter: As demand for electric vehicles sputters, GM is scaling back its EV plans — cutting production and shifting strategy — showing that even the big players are hitting bumps on the EV road. Read more
🧪 FDA commissioner says data showed 10 child deaths due to COVID shots: Agency leadership revealed that their data review linked 10 deaths in children to COVID-19 vaccinations — a serious claim prompting new scrutiny and calls for transparency. Read more
🏦 Who will replace Federal Reserve Chair Jerome Powell? A look at the 5 finalists: With Powell’s term ending in May, the race is heating up among five candidates — including Kevin Hassett, Christopher Waller, and Kevin Warsh — as markets brace for a possible shift in U.S. monetary policy. Read more
🛒 US Black Friday online sales hit record $11.8 billion, says Adobe Analytics: U.S. consumers splurged a record-breaking $11.8 billion online on Black Friday 2025 — a 9.1% jump from last year — as AI-powered tools helped them hunt deals from couches instead of cramped stores. Read more

Gif by BoldArtDegens on Giphy

Bulls will look to leverage December seasonality after some early-month headwinds
Bull markets love reminding traders just how financially and emotionally expensive it is to bet against them.
Sure, evidence can pile up against an aging bull.
But more often than not, history shows that corrections like the 5% drop between 10/28 and 11/20—when they don’t morph into bearish patterns or deliver serious technical damage—tend to act more like a trend refresh than a trend reversal.
Now that the low-liquidity Thanksgiving shuffle has let bulls push the S&P 500 to within 1.0% of all-time highs, plenty of market watchers are whispering about a run to the next big psychological milestone: 7000 (a mere 2.3% above Friday’s close) heading into the historically cheerful month of December.
To get a meaningful sample size of December’s track record, we looked all the way back to the index’s modern inception as a 500-stock benchmark in 1957.
As the far-right column of the table shows, December has ended in the green a hefty 72% of the time since then, with an average gain of +1.3%.
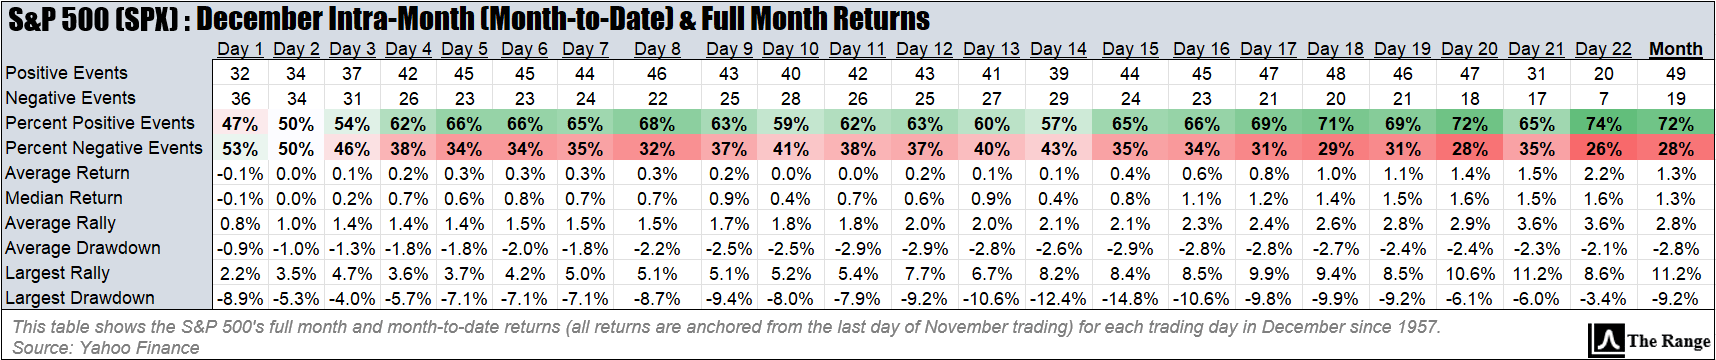
However, as the far-left side of the table shows, bulls can often stumble out of the gate before this month’s bullish tailwinds kick in.
Given how rapidly the VIX fell last week, and how extreme the level of put option buying has fallen relative to call option buying, an early-December pullback in stocks, should it occur, certainly would come as no surprise.

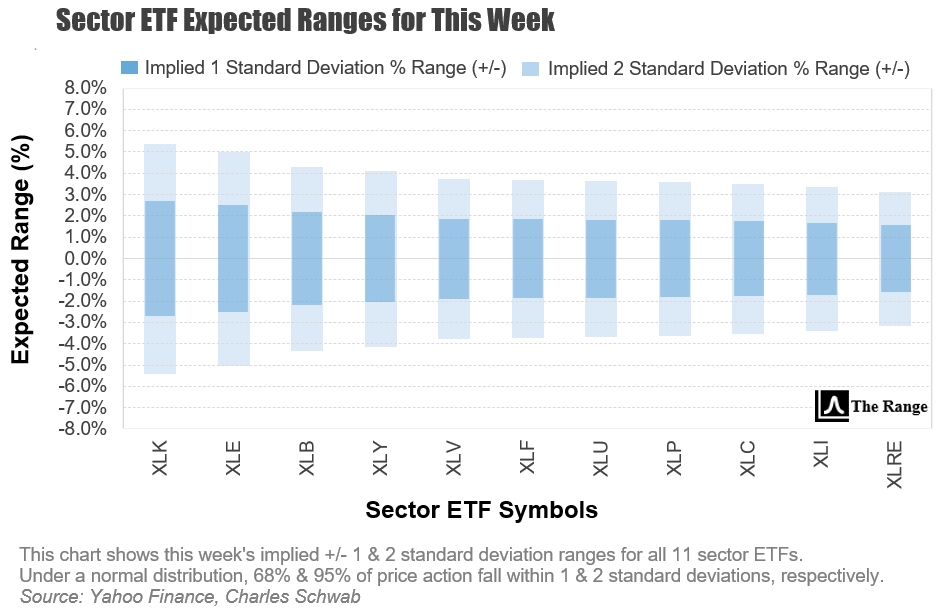
Technology (XLK) remains the sector with the highest implied volatility and the largest expected range over the week ahead. Also showing the largest expected ranges are the energy (XLE) and basic materials (XLB) sectors.
Conversely, the communications (XLC), industrials (XLI) and real estate (XLRE) sectors are where you will find the smallest expected ranges due to low implied volatility.
ℹ️ WHY IS THIS IMPORTANT?
For options traders in particular: Implied volatility sets the tone for option prices. Understanding where large or small implied moves are priced in helps traders decide whether options are over- or under-valued before placing trades.

Monday
Cyber Monday
ISM manufacturing PMI
S&P final U.S. manufacturing PMI
Federal Reserve Officials Speaking: Fed Chair Jerome Powell
Top Earnings: MongoDB
Tuesday
Federal Reserve Officials Speaking: Fed Vice Chair for Supervision Michelle Bowman
Top Earnings: CrowdStrike, Bank of Nova Scotia, Marvell Technology, Pure Storage, Okta, GitLab
Wednesday
ADP employment
Import price index, ISM services PMI (November), S&P final U.S. services PMI
Top Earnings: Salesforce, Royal Bank of Canada, Snowflake, Dollar Tree
Thursday
Initial jobless claims
Federal Reserve Officials Speaking: Fed Vice Chair for Supervision Michelle Bowman
Top Earnings: Toronto Dominion Bank, Bank of Montreal, Canadian Imperial Bank of Commerce, Kroger, Hewlett Packard Enterprise, Ulta Beauty, Dollar General
Friday
Consumer sentiment - preliminary
Consumer credit
Top Earnings: Victoria’s Secret

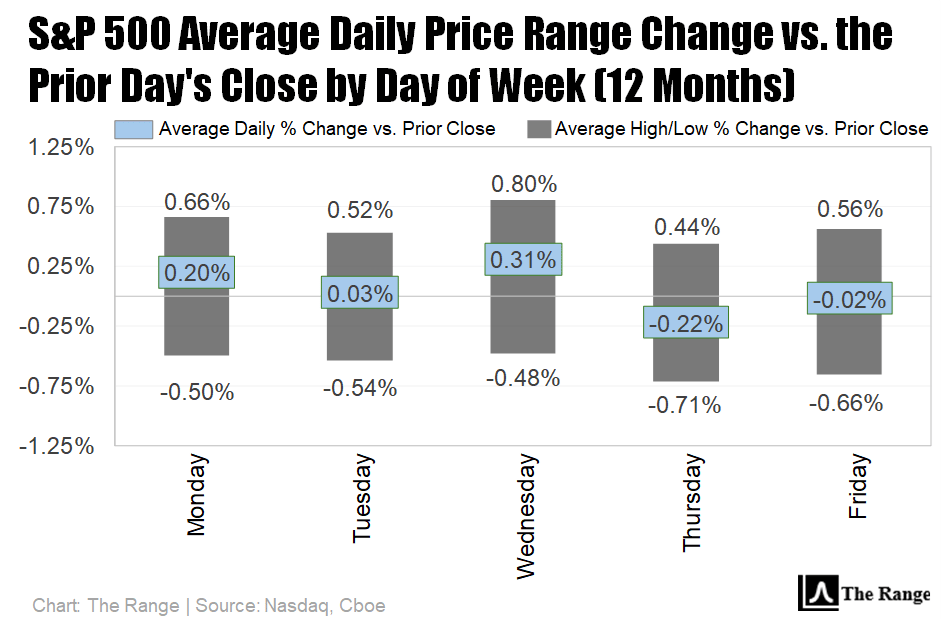
Thanksgiving week is known to produce some outsized daily swings due to the drop-off in liquidity that occurs. Once again, market history did not disappoint last week.
The S&P 500 traded above its bullish norms of the past 12 months on Monday and Tuesday, but stayed within the average limits during Wednesday’s and Friday’s action.
After the VIX witnessed anticipated compression last week, volatility has now fallen so rapidly that a reflexive up-tick in volatility may be in the cards early this week.
📝 EDITOR’S NOTE
Each day the market is open, we update our comprehensive performance charts on our website for you to view. In addition, be sure to follow us on X for timely intra-week updates.

📋Here’s a curated list of top value-added insights that uncover what’s happening way beyond the usual financial media headlines.

Please be sure to follow us on X.
If you like what we're doing, please forward us to a friend. If you're not already subscribed, join our growing family of free subscribers.
Reply