- The Range
- Posts
- Oil Route Drama Returns to Center Stage
Oil Route Drama Returns to Center Stage
Markets eye oil, inflation, earnings, and negotiations as tensions flare back up
👋 Hello and welcome to Monday! 🌅
Here’s what we’re watching:
Middle East tensions reintroduce oil and inflation volatility, not a structural market shift.
Retail sales will test whether the U.S. consumer is still resilient or weakening.
Earnings season begins with Tesla, shaping sentiment on Big Tech’s growth narrative.
Let’s do this! 🛠️👷♂️💪

🔍Strait Tensions Snap Back Into Focus
Markets are still keeping one eye on the Middle East, after things escalated quickly over the weekend. The U.S. Navy reportedly seized an Iranian vessel, damaging its engine room in the process, according to President Donald Trump, which prompted a swift response from Tehran.
Iran fired on nearby ships and shut down traffic through the Strait of Hormuz, walking back earlier signals that some passage would still be allowed. Officials there say the U.S. broke the ceasefire first.
Markets didn’t need much more to get uneasy. The Strait is one of the world’s most important oil chokepoints, so any disruption immediately raises the specter of tighter supply, stickier inflation, and yet another complication in already fragile negotiations. And the Hormuz flare-up is just one of several unresolved pressure points between Washington and Tehran.
That said, geopolitics isn’t the only thing on the calendar. A fresh read on the consumer arrives Monday with March retail sales, offering a reality check on how households are holding up after one of the sharper inflation spikes in recent memory.
The timing matters. With the Fed expected to stay put at next week’s meeting (rate cuts aren’t off the table…they’ve just been pushed further out), investors are looking for clues on whether consumers are still spending freely, or finally starting to tap the brakes. February offered a modest rebound, with retail sales rising 0.6% after a weather-driven dip in January. Now the question is whether that momentum carried into March… or cooled off.
📊 Don’t forget about earnings
The "Magnificent 7" earnings season kicks off Wednesday with Tesla under intense scrutiny, as investors weigh soft EV sales against Elon Musk's strategic pivot toward AI and robotics.
💵 What’s the market pricing in for the week ahead?

ℹ️ WHY IS THIS IMPORTANT?
Knowing what the implied weekly range is helps traders set expectations for what the likely trading limits will be. This can help prevent overreaction near quantified range extremes, while also providing perspective on whether there is still room for an intra-week rally or sell-off to run.
📝 Note: This same logic can also be applied to the “Where’s the Action At?” section below.
Click here 👈 to learn more about our charts.

The “Magnificent 7” earnings parade kicks off Wednesday with Tesla stepping up first, and there’s no shortage of storylines. Between a steady drip of Elon Musk headlines and softer-than-expected EV sales putting pressure on the stock, investors are watching closely to see how convincingly Tesla can sell its next chapter as more than just a car company.
📈 Here’s this week’s lineup of top reports:
Monday
AGNC Investment Corp. (AGNC), Alaska Air Group Inc. (ALK), Bank of Hawaii Corp. (BOH), Cleveland-Cliffs Inc. (CLF), Dynex Capital Inc. (DX), Steel Dynamics Inc. (STLD), Zions Bancorporation NA (ZION)
Tuesday
Capital One Financial Corp. (COF), Chubb Ltd. (CB), Danaher Corp. (DHR), D.R. Horton Inc. (DHI), EQT Corp. (EQT), Halliburton Co. (HAL), Interactive Brokers Group Inc. (IBKR), Intuitive Surgical Inc. (ISRG), 3M Co. (MMM), MSCI Inc. (MSCI), Northrup Grumman Corp. (NOC), RTX Corp. (RTX)
Wednesday
AT&T Inc. (T), Boeing Co. (BA), Boston Scientific Corp. (BSX), CME Group Inc. (CME), CSX Corp. (CSX), GE Vernova Inc. (GEV), International Business Machines Corp. (IBM), Lam Research Corp. (LRCX), Phillip Morris International Inc. (PM), ServiceNow Inc. (NOW), Tesla Inc. (TSLA), Vertiv Holdings Co. (VRT)
Thursday
American Express Co. (AXP), Blackstone Inc. (BX), Digital Realty Trust Inc. (DLR), Freeport-McMoRan Inc. (FCX), Gilead Sciences Inc. (GILD), Honeywell International Inc. (HON), Intel Corp. (INTC), Lockheed Martin Corp. (LMT), Newmont Corp. (NEM), Nextera Energy Inc. (NEE), SAP SE (SAP), Union Pacific Corp. (UNP)
Friday
Charter Communications Inc. (CHTR), HCA Healthcare Inc. (HCA), Norfolk Southern Corp. (NSC), Procter & Gamble Co. (PG), SLB NV (SLB)
👇 Below is a look at this week’s biggest earnings reports, sorted by market cap:
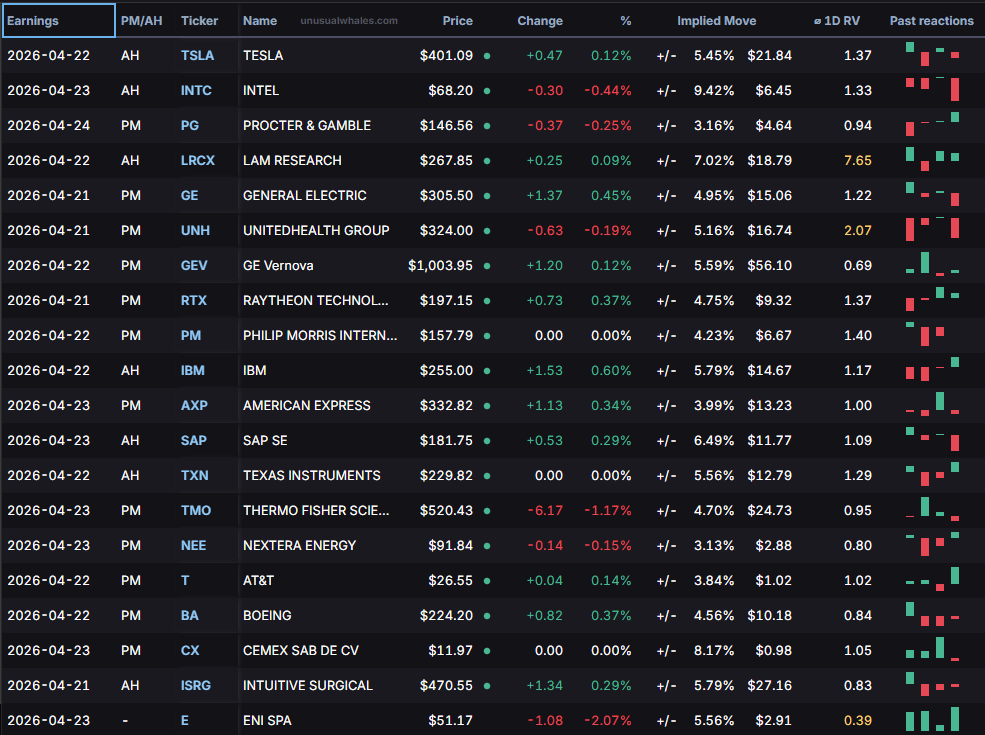
🤔 Which companies are poised to possibly over- or underreact to earnings this week?
The largest company to report earnings this week, Tesla, has a history of trading outside of the market makers’ expected range during the session immediately following earnings (keep reading below the next table for more details on how this is calculated).
Of the 20 largest companies reporting earnings this week, Lam Research shows the greatest tendency by far to overshoot the implied price range immediately following earnings is greatest.
On the other side of the coin, of the top 20 companies reporting this week, ENI SPA has the greatest likelihood of staying inside its post-earnings expected range (keep reading below the next table for more details).
HOW CAN TRADERS USE THIS INFORMATION?
For active traders looking to trade some of this week’s earnings plays, the highlighted columns on the table above show the implied (expected) post-earnings move for each company, along with the Average 1-Day Realized Volatility Post-Earnings Ratio (1D RV).
📈 Implied Move: The market’s best guess at how much a stock will swing after earnings.
📊 1D RV: A powerful tool that represents the post-earnings price move divided by the expected price move over the past 12 quarters. In other words, it measures how good (or bad) the market is at pricing each company’s earnings.
💵 When you see a ratio >1.0, it indicates that, historically, the earnings are mispriced and the stock moves MORE than the market anticipates, favoring straddle buyers.
🪝 A ratio <1.0 tells the opposite story, meaning the stock historically moves LESS than the market anticipates, which favors straddle sellers.
Happy hunting.

🕵️ NSA using Anthropic's Mythos despite Defense Department blacklist: In what can only be described as the government's most awkward relationship, the NSA is quietly using Anthropic's powerful new Claude Mythos Preview AI model to scan for cybersecurity vulnerabilities, even as the Pentagon, which literally oversees the NSA, has blacklisted Anthropic as a "supply chain risk" and is currently suing the company, proving that in Washington, "we hate you, but also please fix our security holes" is apparently a perfectly coherent policy position. Read more
💻 Morgan Stanley takes a deeper look at AI's impact on software developers: In news that will make developers both relieved and slightly annoyed that they still have to show up to work, a new Morgan Stanley report finds that AI isn't killing software engineering jobs but is instead shifting the bottleneck from writing code to reviewing, testing, and managing the increasingly chaotic flood of AI-generated code, meaning experienced engineers are actually more in demand than ever, just now as the humans responsible for cleaning up after the robots. Read more
🚀 In its third flight, a Blue Origin New Glenn rocket puts satellite payload into wrong orbit: Blue Origin had a classic "nailed the dismount, forgot the routine" moment Sunday when its New Glenn rocket successfully reused a booster for the first time AND stuck the ocean landing, but then promptly delivered AST SpaceMobile's BlueBird 7 satellite into a completely wrong orbit so low it can't function and will have to be burned up in the atmosphere, though thankfully the satellite was fully insured because someone had the foresight to prepare for exactly this kind of day. Read more

Gif by FullMag on Giphy
👋 Meta layoffs begin May 20 with 8,000 employees affected: Meta, which just posted $201 billion in revenue and a $60 billion profit last year, has scheduled the first wave of its 2026 layoffs for May 20, cutting roughly 8,000 employees (10% of its workforce), with more cuts planned for the second half of the year, all so Zuckerberg can funnel up to $135 billion into AI infrastructure because apparently making one of the most profitable years in tech history isn't quite enough to fund his robot future. Read more
📈 Regulators are reportedly zeroing in on suspicious trades ahead of market-moving Trump post: The Commodity Futures Trading Commission is now investigating a pattern of eerily well-timed oil futures trades that spiked in volume just minutes before President Trump posted to Truth Social about pausing strikes on Iran, moves that sent markets surging and oil tumbling, raising serious questions about whether someone with insider knowledge of White House decisions was placing very, very lucky bets, which senators are calling "insider trading" and which at least one exchange is calling "a reason to also investigate prediction markets." Read more

The high-voltage trio leading the volatility expectations for this week are energy (XLE), tech (XLK), and consumer discretionary (XLY).
For energy, all eyes are on the 2026 Iran war and potential reopening of the Strait of Hormuz, along with any potential OPEC+ signals for crude price movement. Tech traders will be locked in on critical first-quarter earnings from Tesla, Intel, and IBM, as well as Senate testimony from Fed chair nominee Kevin Warsh. And in consumer discretionary, Tuesday's U.S. retail sales data is the main event — investors want to know if the American consumer is still showing up despite regional conflict and surging fuel costs.
On the quieter end of the spectrum, real estate (XLRE), consumer staples (XLP), and healthcare (XLV) are where the market's blood pressure drops considerably. REIT watchers will be parsing the 30-year mortgage rate, which recently hit 6.38%, for signs of relief in an oversold sector. Staples investors are keeping it simple — they want to see if defensive positioning is attracting fresh inflows as the S&P 500 tests record 7,000 levels. And in healthcare, the week's focus lands squarely on UnitedHealth Group earnings and any drug pricing policy developments out of Washington that could move the needle on the sector's already cautious sentiment.

ℹ️ WHY IS THIS IMPORTANT?
For options traders in particular: Implied volatility sets the tone for option prices. Understanding where large or small implied moves are priced in helps traders decide whether options are over- or under-valued before placing trades.

Monday
No major events
Tuesday
08:15 AM — ADP Employment Change: Previous 39K
08:30 AM — Retail Sales MoM MAR: Previous 0.6% | Consensus 1.3% | Forecast 1.1%
08:30 AM — Retail Sales Control Group MoM MAR: Previous 0.5% | Forecast 0.6%
08:30 AM — Retail Sales Ex Autos MoM MAR: Previous 0.5% | Consensus 1% | Forecast 0.9%
10:00 AM — Business Inventories MoM FEB: Previous -0.1% | Consensus 0.1% | Forecast 0.1%
10:00 AM — Pending Home Sales MoM MAR: Previous 1.8% | Consensus 0.5% | Forecast 0.5%
10:00 AM — Pending Home Sales YoY MAR: Previous -0.8% | Forecast 0.7%
02:30 PM — Fed Waller Speech
04:30 PM — API Crude Oil Stock Change APR/17: Previous 6.1M | Consensus -1M
Wednesday
07:00 AM — MBA 30-Year Mortgage Rate APR/17: Previous 6.42%
10:30 AM — EIA Crude Oil Stocks Change APR/17: Previous -0.913M | Consensus -1M
10:30 AM — EIA Gasoline Stocks Change APR/17: Previous -6.328M
Thursday
08:30 AM — Chicago Fed National Activity Index MAR: Previous -0.11 | Forecast 0.2
08:30 AM — Initial Jobless Claims APR/18: Previous 207K | Consensus 212K | Forecast 218.0K
09:45 AM — S&P Global Composite PMI Flash APR: Previous 50.3 | Forecast 49.9
09:45 AM — S&P Global Manufacturing PMI Flash APR: Previous 52.3 | Consensus 52.5 | Forecast 52
09:45 AM — S&P Global Services PMI Flash APR: Previous 49.8 | Consensus 50.1 | Forecast 49.6
Friday
10:00 AM — Michigan Consumer Sentiment Final APR: Previous 53.3 | Consensus 47.6 | Forecast 47.6

Here’s a look at the average movement the S&P 500 has witnessed during each trading day over the past 12 months.

📝 EDITOR’S NOTE
Each day the market is open, we update our comprehensive performance charts on our website for you to view. In addition, be sure to follow us on X for timely intra-week updates.

📋Here’s a curated list of top value-added insights that uncover what’s happening way beyond the usual financial media headlines.

Gif by WilmaWackelt on Giphy
Please be sure to follow us on X.
If you like what we're doing, please forward us to a friend. If you're not already subscribed, join our growing family of free subscribers.
Reply