- The Range
- Posts
- Nvidia/PCE Hold the Keys the Market's Ability to Keep Rallying
Nvidia/PCE Hold the Keys the Market's Ability to Keep Rallying
Powell’s “may warrant” comment at Jackson Hole sent markets soaring—but PCE/NVDA could spoil the party.
👋Hello and Happy Monday! 🌅
Here’s what’s on deck this week:
The S&P 500’s expected range for the week is 6596 to 6337.
Is this Nvidia’s most important earnings report ever?
Fed’s favorite inflation gauge drops later this week.
Data could tip September’s first rate cut decision.
Let’s get going.▶️▶️

🗓️ This week’s market spotlight is basically a two-hander: Nvidia (NVDA) and inflation. Nvidia drops earnings Wednesday, and Wall Street wants to know if the AI darling can keep smashing sales records while juggling China’s $8B export curbs and a new revenue-sharing deal with the Trump administration.
Meanwhile, Friday’s PCE inflation report—the Fed’s favorite—could make or break September rate-cut hopes after Powell’s dovish turn last week. Sprinkle in earnings from Dell, CrowdStrike, Snowflake, and some Canadian banks, plus trade and housing data, and we’ve got ourselves another jam-packed week.

Click here 👈to learn more about our charts.
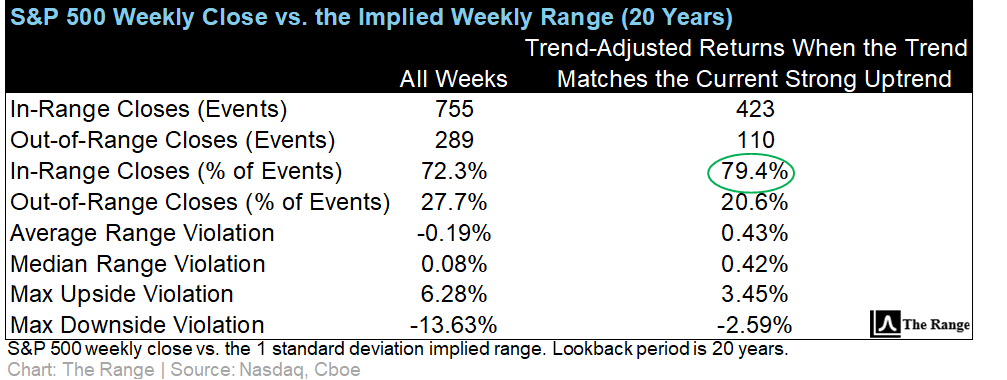
Once again, the S&P 500 ended last week’s trading with “strong uptrend” characteristics.
Based on the past 20 years of weekly data, the S&P 500 cash index (SPX) has closed within its implied range 79.4% of the time while trading in a strong uptrend. Odds are favorable that this to continue until the trend reverses.

📊Nvidia reports Wednesday, and Wall Street’s watching to see if the AI king can keep smashing sales records despite $8B in China export curbs. The company may update investors on its China strategy, including a revenue-sharing deal with the Trump administration and new product plans.
Also on deck this week: earnings from Marvell, Dell, CrowdStrike, Snowflake, Autodesk, and a few Canadian banks.
👇 Below, is a look at this week’s biggest earnings reports, sorted by market cap.
This week’s biggest earnings reports (NVDA and BABA) may be poised to move beyond their implied ranges following earnings.
At the opposite end of the spectrum, Royal Bank of Canada (RY) and BHP Group (BHP) are the largest stocks showing potential to trade well within their expected ranges following earnings (keep reading below this table for more details).

Source: Unusual Whales
For active traders looking for actionable insights, the highlighted columns on the table above show the implied (expected) post-earnings move for each company, along with the Average 1-Day Realized Volatility Post Earnings Ratio (1D RV).
📈Implied Move: The market’s best guess at how much a stock will swing after earnings.
📊1D RV: A powerful tool that represents the post-earnings price move divided by the expected price move over the past 12 quarters. In other words, it measures how good (or bad) the market is at pricing each company’s earnings.
💵When you see a ratio >1.0, indicates that, historically, the earnings are mispriced and the stock moves MORE than the market anticipates, favoring straddle buyers.
🪝A ratio <1.0 tells the opposite story, meaning the stock historically moves LESS than the market anticipates, which favors straddle sellers.
Happy hunting.

From the Market’s Perspective, This Just May be Nvidia’s Most Important Earnings Report Ever
Wall Street’s biggest player takes center stage this week: Nvidia. The $3T chip king reports after the bell on Wednesday, and its numbers could decide whether this summer’s rally has legs or fizzles.
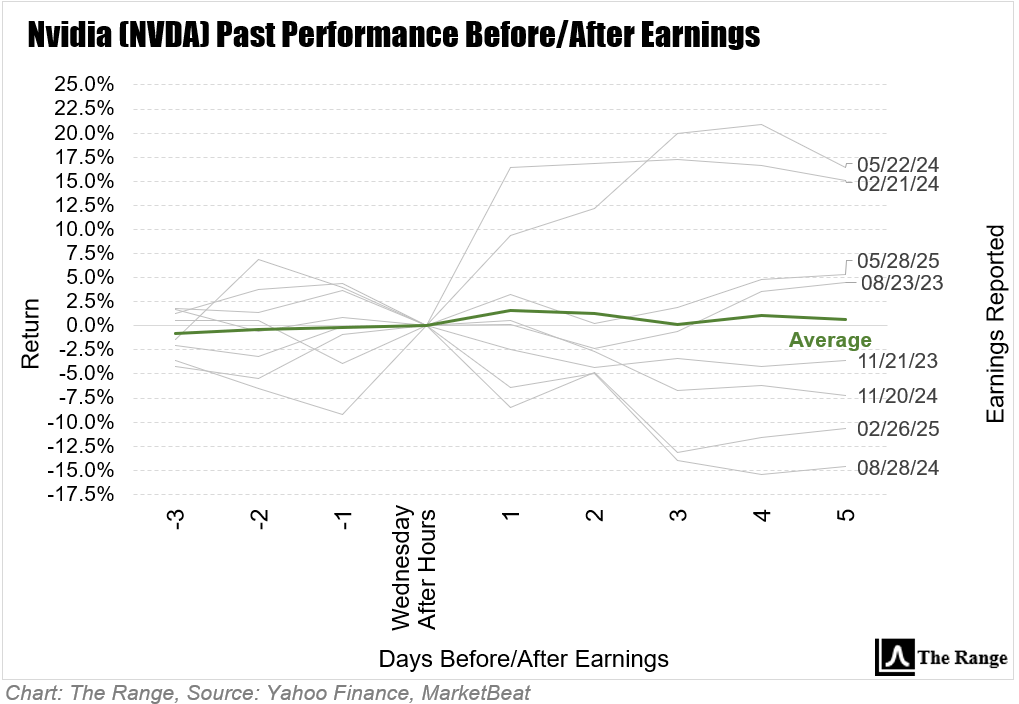
A quick look at the past 8 earnings reports shows that Nvidia’s earnings have been followed by some big moves in the days that immediately follow.
With stocks back near records after Powell’s Jackson Hole pivot, Nvidia’s results are less about one company and more about the entire AI trade that’s powered 2024’s bull market.
The stock has nearly doubled since April, making it the single biggest driver of S&P performance — and the tech sector’s fate may hinge on whether it delivers another blockbuster quarter.
Analysts expect $46B in sales, but China headwinds and sky-high expectations mean anything short of a beat could rattle markets far beyond semis. In short: Nvidia isn’t just reporting earnings this week, it’s reporting on the state of the rally.
Over the past 12 quarterly earnings reports, NVDA has never developed a bearish trajectory more than 50% of the time during the windows shown on the table below. While the average short-to-near-term price path tends to be positive following earnings, this table also shows that the best historical performance (62.5%) really isn’t much for bulls to hang their hats on either.

Currently, NVDA trades with a very strong trailing 1-quarter correlation of 0.97. That means that, over the past 3 months, the stock has basically moved in lock-step with the S&P 500.

When we also consider that NVDA is the most heavily weighted stock in both the S&P 500 and Nasdaq 100 ETFs (SPY and QQQ, respectively), and that NVDA has had a history of leading the S&P 500 at market tops, bulls are hoping NVDA can stay above 164.58/share post earnings to prevent another market-leading breakdown.

🏠 Housing market: New Zillow ratings reveal whether it’s a buyer’s or seller’s market in over 250 metros: Zillow just dropped a giant real estate vibe check, ranking 250+ metros on who holds the power—buyers or sellers—so you know if it’s time to lowball or overpay while crying into your mortgage calculator. Read more
🌍 Europe’s economy can’t grow without migrants: ECB boss Christine Lagarde basically told Europe to send a thank-you card to immigrants, since without them the economy would stall harder than a teenager learning stick shift. Read more
📡 Meta is sinking $10 billion into rural internet. The catch?: Meta’s big bet on wiring rural America with faster internet sounds noble, until you realize it’s also a $10 billion play to get more eyeballs scrolling Instagram in cornfields. Read more
🤖 Nvidia earnings set to test AI trade, with stocks near record highs: Nvidia’s earnings report this week is the ultimate AI stress test, with Wall Street holding its breath like it just asked ChatGPT to write a love letter that doesn’t sound like a toaster. Read more
💸 Federal Reserve in a bind over high inflation and politics as Trump attacks Powell: The Fed’s inflation fight is messy enough, but now with Trump taking swings at Chair Jerome Powell, monetary policy feels less like economics and more like a WWE cage match. Read more

Although the CBOE Volatility Index’s (VIX) slide to low levels not seen since the middle of December 2024 last week implies that volatility is expected to remain low of over the next 30 days, the speed at which volatility suppression occurred may introduce a reflexive rebound in volatility this coming week.

Click here 👈to learn more about our charts.

EDITOR’S NOTE
Each day the market is open, we update our comprehensive daily performance charts on our website for you to view. In addition, be sure to follow us on X for timely intra-week updates.

Monday
New home sales (July)
Key Earnings: PDD Holdings
Tuesday
Consumer confidence (August)
Federal Reserve Officials Speaking: Richmond Fed President Tom Barkin
More Data to Watch: Durable-goods orders (July), S&P Case-Shiller home price index (June)
Key Earnings: Bank of Montreal, Bank of Nova Scotia, MongoDB , Okta
Wednesday
Federal Reserve Officials Speaking: Richmond Fed President Tom Barkin
Key Earnings: Nvidia, Royal Bank of Canada, CrowdStrike, Snowflake, Veeva Systems, Agilent Technologies, HP
Thursday
Gross domestic product - first revisions (Q2)
More Data to Watch: Initial jobless claims (Week ending Aug. 23), Pending home sales (July)
Key Earnings: Toronto Dominion Bank, Dell Technologies, Canadian Imperial Bank of Commerce, Marvell Technology, Autodesk, Li Auto, Affirm Holdings, Dollar General
Friday
Personal Consumption Expenditures (PCE) (July)
More Data to Watch: Consumer sentiment - final (August), U.S. trade balance (July), retail inventories (July), wholesale inventories (July)

Below is our curated list of top value-added insights that uncover what’s happening way beyond the usual financial media headlines.
The S&P 500 has struggled after the first Fed rate cut after a pause. JPM
I'd say it's the reason for the cut that matters.
— Mike Zaccardi, CFA, CMT 🍖 (@MikeZaccardi)
10:49 AM • Aug 22, 2025
Rate cut odds are now lower than before Powell spoke.
— Godzilla Trader 🦖 (@David_Tracey)
10:44 AM • Aug 24, 2025
Friday was a 91.5% upside day, which we usually see towards the beginning of a move, not after an extended one. (I report; you decide.) UVOL/(UVOL+DVOL); Lowry’s definition. Data per . See cmtassociation.org/wp-content/upl… for explanation.
— Walter Deemer (@WalterDeemer)
4:58 PM • Aug 24, 2025
⚠️This is truly WILD:
NVIDIA's market cap is now just ~$1 TRILLION below the Japanese stock market.
As a reminder, Japan's market is the 2nd largest in the world, after the US.
$NVDA is larger than the UK, China, Canada, France and Germany.
This is not sustainable.
— Global Markets Investor (@GlobalMktObserv)
5:30 PM • Aug 24, 2025
🚨🚨🚨 the major Silver miners breaking out of a 14 year base this week. time to pile into the Silver smallcaps, as a mania is about to unfold.
— Gold Ventures 🟡 (@TheLastDegree)
2:37 PM • Aug 23, 2025

Please be sure to follow us on X.
If you like what we're doing, please forward us to a friend. If you're not already subscribed, join our growing family of free subscribers.
Reply