- The Range
- Posts
- Markets Brace for Another Volatile Week as Geopolitics and Data Collide
Markets Brace for Another Volatile Week as Geopolitics and Data Collide
Labor, retail, and confidence data enter the mix as Trump's tweets fail to calm markets
👋 Hello and welcome to Monday! 🌅
Here’s what we’re watching:
Geopolitics and economic data will jointly drive market sentiment after a weak stretch for stocks.
Labor, retail, and confidence data will shape expectations for consumer and economic resilience.
Nike and Conagra earnings offer key signals on discretionary vs. staple spending trends.
After the VIX’s Friday close at the highest levels since April ‘25, the upward-sloping trend in volatility remains fully entrenched.
Let’s get a move on! 🏎️🛼🏃♂️➡️

🔍The Fed has its eye on jobs (and the consumer)
The labor market takes center stage this week, with fresh data offering clues on whether recent softness is a blip or the start of something more persistent. A key jobs report later in the week will headline, while earlier data on private-sector hiring should help set the tone. In other words, investors are looking for confirmation, either that hiring is stabilizing or that cracks are widening.
That matters because the Federal Reserve is already in a tricky spot. After easing policy late last year, sticky inflation has kept officials on pause. If the labor market continues to cool, that balancing act gets harder, and the pressure to respond builds.
It’s not just about jobs. Fresh retail sales data will show whether consumers carried early-year momentum forward or pulled back, while a new read on confidence should capture how households are processing ongoing geopolitical tension. Put it all together, and this week’s data could go a long way in shaping the near-term outlook for both growth and policy.
💵 What’s the market pricing in for the week ahead?

ℹ️ WHY IS THIS IMPORTANT?
Knowing what the implied weekly range is helps traders set expectations for what the likely trading limits will be. This can help prevent overreaction near quantified range extremes, while also providing perspective on whether there is still room for an intra-week rally or sell-off to run.
📝 Note: This same logic can also be applied to the “Where’s the Action At?” section below.
Click here 👈 to learn more about our charts.

📈 Nike headlines a slow week of earnings
On the corporate side, the calendar is relatively light, but a few names could still move markets. Nike headlines the week, with investors focused on demand trends, margins, and the impact of global volatility on guidance.
Outside of earnings, updates tied to AI demand, semiconductor trends, and broader corporate commentary will matter just as much, especially as markets look ahead to the start of earnings season in mid-April.
🤔 Which companies are poised to possibly over- or underreact to earnings this week?
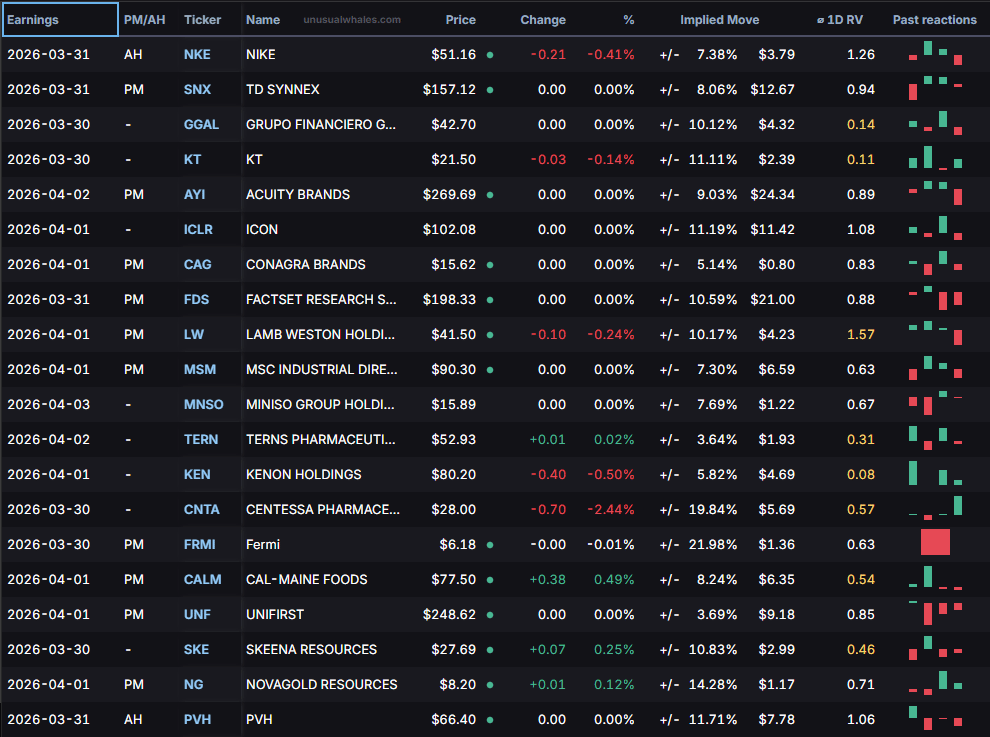
The largest company to report earnings this week, Nike, has a history of trading outside of the market makers’ expected range during the trading session immediately following earnings (keep reading below the next table for more details on how this is calculated).
Of the 20 largest companies reporting earnings this week, Lamb Weston Holdings’ tendency to overshoot the implied price range immediately following earnings is greatest.
On the other side of the coin, of the top 20 companies reporting this week, Kenon Holdings shows the greatest likelihood of staying inside its post-earnings expected range (keep reading below the next table for more details).
👇 Below is a look at this week’s biggest earnings reports, sorted by market cap:
HOW CAN TRADERS USE THIS INFORMATION?
For active traders looking to trade some of this week’s earnings plays, the highlighted columns on the table above show the implied (expected) post-earnings move for each company, along with the Average 1-Day Realized Volatility Post-Earnings Ratio (1D RV).
📈 Implied Move: The market’s best guess at how much a stock will swing after earnings.
📊 1D RV: A powerful tool that represents the post-earnings price move divided by the expected price move over the past 12 quarters. In other words, it measures how good (or bad) the market is at pricing each company’s earnings.
💵 When you see a ratio >1.0, it indicates that, historically, the earnings are mispriced and the stock moves MORE than the market anticipates, favoring straddle buyers.
🪝 A ratio <1.0 tells the opposite story, meaning the stock historically moves LESS than the market anticipates, which favors straddle sellers.
Happy hunting.

📰 Major Wall Street powerhouse weighs Southern move as Mamdani-led tax threats swirl: A Wall Street behemoth is flirting with a Southern migration faster than a snowbird chasing sunshine, as NYC's Zohran Mamdani rallies tax hikes that make Manhattan rents look like a bargain—time to swap skyscrapers for sweet tea? Read more
🤖 Meta's court losses spell trouble for AI research, consumer safety: Meta's courtroom stumbles are piling up like unchecked server racks, threatening to crimp its AI ambitions and leave consumer protections as glitchy as a beta app nobody tested. Read more
✈️ Summer Travel: Americans Stay Home Due to High Oil Prices, TSA Chaos: Oil prices soaring to $6/gallon amid Iran tensions, cartel jitters, and TSA lines rivaling Black Friday are herding Americans back to staycations—backyard hammocks never looked so luxurious. Read more

Gif by PoochofNYC on Giphy
📈 One AI bubble has already burst. The next one—a ‘rare' kind—is still growing, economist warns: Economists say the AI stock bubble deflated quicker than a hype man's ego, but a sneakier earnings balloon in Big Tech is still inflating—Nvidia's got the hot air, but will it pop mid-flight? Read more
🔒 EU clamps down on Big Tech data use for AI: European watchdogs are gatecrashing Big Tech's data party with strict new rules on AI training fodder, leaving Zuck and crew rummaging through scraps like dieters at an all-you-can-eat buffet gone wrong. Read more

The market’s highest volatility is expected to arrive in tech (XLK), consumer discretionary (XLY), and energy (XLE), over the next five days. In tech (XLK), investors will be watching AI-related announcements, chip demand signals, and any shifts in forward guidance tone. Consumer discretionary (XLY) puts the spotlight on retail data, pricing trends, and updates on consumer strength. In energy (XLE), it’s all about crude price direction, geopolitical developments, and any commentary from major producers that could hint at supply changes.
At the calmer end, health care (XLV), real estate (XLRE), and staples (XLP) are expected to be more subdued. In health care (XLV), attention turns to drug pipeline updates, regulatory decisions, and insurer commentary. Real estate (XLRE) investors are focused on rate-sensitive data and signals around financing conditions. Staples (XLP) will be driven by pricing power, margin stability, and whether consumers continue to absorb higher costs without trading down.

ℹ️ WHY IS THIS IMPORTANT?
For options traders in particular: Implied volatility sets the tone for option prices. Understanding where large or small implied moves are priced in helps traders decide whether options are over- or under-valued before placing trades.

Monday
Dallas Fed Manufacturing Index
Fed Chair Powell Speech, Fed Williams Speech
Tuesday
S&P/Case-Shiller Home Price Index, Chicago PMI, JOLTS Job Openings, Consumer Confidence
Fed Goolsbee Speech, Fed Barr Speech
API Crude Oil Stock Change
Wednesday
MBA Mortgage Applications, ADP Employment Change, Retail Sales, Retail Sales Control Group, Retail Sales Ex Autos
Fed Musalem Speech, Fed Barr Speech
ISM Manufacturing PMI, Business Inventories, ISM Manufacturing Employment
EIA Crude Oil Stocks Change, EIA Gasoline Stocks Change
Thursday
Balance of Trade, Exports, Goods Trade Balance, Imports, Initial Jobless Claims,
Fed Logan Speech
Friday
Nonfarm Payrolls, Unemployment Rate, Average Hourly Earnings, Labor Force Participation Rate

Geopolitics isn’t taking the week off. Developments tied to the Iran conflict are still front and center for investors, but they’ll be sharing the spotlight with a steady drumbeat of economic data and corporate updates after another rough stretch for stocks.
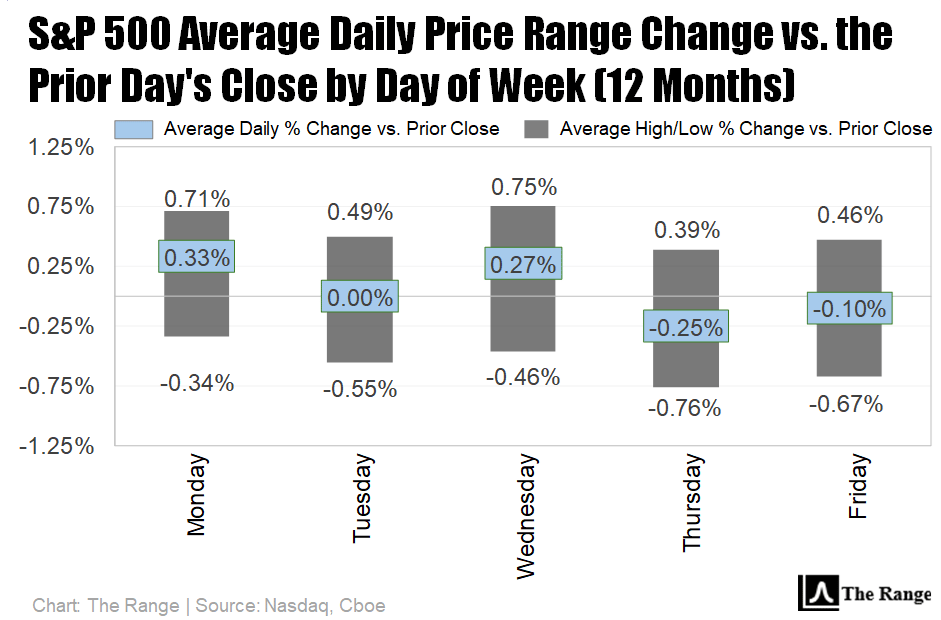
S&P 500 futures may be a tad lower to start the week as of this writing, but after the Cboe Volatility Index’s Friday close at the highest levels since April ‘25 the upward-sloping trend in volatility remains fully entrenched.
As a result, the potential for the benchmark S&P 500 to move beyond its average daily ranges this week remains elevated once again.
📝 EDITOR’S NOTE
Each day the market is open, we update our comprehensive performance charts on our website for you to view. In addition, be sure to follow us on X for timely intra-week updates.

📋Here’s a curated list of top value-added insights that uncover what’s happening way beyond the usual financial media headlines.

Gif by sesamestreet on Giphy
Please be sure to follow us on X.
If you like what we're doing, please forward us to a friend. If you're not already subscribed, join our growing family of free subscribers.
Reply