- The Range
- Posts
- Jobs, Other Delayed Data Finally Arrive as Stocks Prepare for Santa
Jobs, Other Delayed Data Finally Arrive as Stocks Prepare for Santa
In terms of seasonality, this week is crucial to bulls' efforts to capture late-month tailwinds
👋Hello and Welcome to Monday! 🌅
Here’s what we’re watching this week:
Data flood incoming: delayed jobs, inflation, and retail reports finally hit traders’ screens.
Seasonal shift ahead: December’s seasonal pattern bottoms this week ahead of better late-month performance.
Fed on wait-and-see: Powell wants more data; governors’ remarks could move markets.
Earnings pulse check: Micron tests the AI trade while Nike and FedEx read the consumer.
Let’s dive in!💦💦💦

💵What’s the market pricing in for the week ahead?
The data drought is over. After last week’s rate cut—framed squarely around cracks in the labor market—the Fed is about to get a fresh stack of receipts.
On Tuesday, the Bureau of Labor Statistics drops November jobs data, giving investors a clearer read on whether hiring is actually cooling or just playing possum. That same day brings October retail sales and September business inventories, offering a temperature check on how willing consumers still are to swipe, tap, and splurge.
Then comes the main event: Thursday’s CPI report. November inflation data will help answer the trillion-dollar question—are tariffs quietly creeping back into prices as the Fed looks toward 2026?
Fed speakers, grab your popcorn.
Two governors with ties to President Trump are on the mic this week. Stephen Miran speaks Monday morning after voting for a bigger cut last week, while Christopher Waller—often mentioned as a future Fed chair—addresses a room full of CEOs on Wednesday. Markets will be listening for hints, not headlines.

ℹ️ WHY IS THIS IMPORTANT?
For both stock and options traders: Knowing what the implied weekly range is helps set expectations for what the likely trading limits will be. This can help prevent overreaction near quantified range extremes, while also informing the traders on whether there is still room for an intra-week rally or sell-off to run.
📝 Note: This same logic can also be applied to the “Where’s the Action At?” section below.
Click here 👈 to learn more about our charts.

📈 Earnings: AI checks in, consumers get examined
While Big Tech mostly wrapped up earnings season, Micron Technology takes the baton Wednesday. The memory-chip maker is one of the AI trade’s biggest winners, with shares up more than 200% over the past year—expect expectations to be just as lofty.
On the consumer front, Nike reports Thursday as its turnaround gains traction, even as tariffs remain a lingering risk. Investors will also scan results from CarMax, General Mills, Conagra, Darden Restaurants, Birkenstock, and Carnival for clues on how resilient household spending really is.
And don’t sleep on FedEx. The shipping giant reports Thursday after reinstating its full-year outlook, projecting 4%–6% revenue growth despite tariff headwinds. As always, its numbers double as a proxy for the broader economy’s pulse.
🤔 Which companies are poised to possibly over- or underreact to earnings this week?
The largest company to report earnings this week, Micron Technology, has shown only a very slight tendency to move outside of the market makers’ expected range during the trading session immediately following earnings (keep reading below the next table for more details on how this is calculated).
Of the 20 largest companies reporting earnings this week, Cintas, has the strongest tendency to overshoot the implied price range immediately following earnings.
On the other side of the coin, of the top 20 companies reporting this week, Carnival shows the greatest likelihood of staying inside its post-earnings expected range (keep reading below the next table for more details).
👇 Below is a look at this week’s biggest earnings reports, sorted by market cap:

HOW CAN TRADERS USE THIS INFORMATION?
For active traders looking to trade some of this week’s earnings plays, the highlighted columns on the table above show the implied (expected) post-earnings move for each company, along with the Average 1-Day Realized Volatility Post-Earnings Ratio (1D RV).
📈Implied Move: The market’s best guess at how much a stock will swing after earnings.
📊1D RV: A powerful tool that represents the post-earnings price move divided by the expected price move over the past 12 quarters. In other words, it measures how good (or bad) the market is at pricing each company’s earnings.
💵When you see a ratio >1.0, it indicates that, historically, the earnings are mispriced and the stock moves MORE than the market anticipates, favoring straddle buyers.
🪝A ratio <1.0 tells the opposite story, meaning the stock historically moves LESS than the market anticipates, which favors straddle sellers.
Happy hunting.

📀 Gen Z’s search for decorative collectibles is fueling vinyl sales: Gen Z is driving a big vinyl renaissance by buying records more as aesthetic art pieces and shelf flexes than to actually play them, with about 60% of young buyers snagging albums even without owning a turntable. Read more

Gif by ABCMusic on Giphy
📺 Paramount and Netflix face similar antitrust hurdles in Warner Bros Discovery bids, expert says: A legal pro warns that both Paramount’s all-cash bid and Netflix’s stock-and-cash deal to buy Warner Bros. Discovery will draw serious regulatory scrutiny, with antitrust considerations likely shaping how either suitor can proceed. Read more
🛡️ ServiceNow reportedly in talks to acquire cybersecurity startup Armis for up to $7 Billion, Bloomberg News reports: ServiceNow is close to a blockbuster deal to buy Armis — a fast-growing security platform for connected devices — in a move that could push its cybersecurity footprint into new strategic territory as cyberthreats surge. Read more
📱 Apple 0-Day Vulnerabilities Exploited in Sophisticated Attacks Targeting iPhone Users: Two freshly patched WebKit zero-day bugs were actively abused in targeted spyware campaigns affecting iPhone and iPad users not yet updated to iOS/iPadOS 26.2, underscoring the urgent need for users to install the latest security fixes. Read more
🧠Grok got crucial facts wrong about Bondi Beach shooting:Elon Musk’s AI chatbot Grok repeatedly spread misinformation about the Bondi Beach shooting — misidentifying the real hero and confusing videos and context in a way that underscores how unreliable the AI can be for fact-checking serious events.Read more

EDITOR’S NOTE: We’re excited to introduce you to Market Rhymes, our premium service hosted on Substack at https://marketrhymes.substack.com/. Market Rhymes will remain free for the next several months as we continue to build out the framework and earn the trust of our readers. Even when premium content is put behind a paywall, we’ll continue to post a ton of free content via Substack “Notes.” The chart highlighted in this content block is an example of the next-level analysis that we’re currently building. Please join us on this journey at https://marketrhymes.substack.com/ .
🎅Santa’s Potential Path
No. The “Santa Claus rally” isn’t over.
In fact, it hasn’t even started.
The strength seen in stocks last Wednesday and Thursday was largely an anticipated reaction the Federal Reserve’s final interest rate cut of 2025. Yet, in an unsurprising rush to attract clicks, many financial media outlets cited Friday’s downside reversal as being the end of this year’s visit from ol’ Saint Nick.
Known for the bullish tailwinds that typically make their way through the stock market during this widely followed seasonal phenomenon, traders and active investors will have to wait until late December to see if holiday spirit returns to the market.
This seasonal window, discovered in 1972 by Yale Hirsch, the founder of the The Stock Trader's Almanac, officially runs from the last five trading days of December through the first two trading days of January.
So why does Santa tend to show up fashionably late?
A few reasons—none proven, all persistent:
Risk appetite tends to rise when traders are feeling jollier and headlines are quieter.
With institutional desks partially staffed, retail investors—historically more bullish—have a bigger influence.
Year-end cash, retirement contributions, and fund inflows often hit markets in late December.
Once investors finish dumping losers for tax reasons, selling pressure eases.
Portfolio managers often scoop up winners to make year-end holdings look sharper.
Less liquidity means it takes less buying to push prices higher.
With seven trading days left before this bullish period event begins, today’s seasonal chart shows just how closely the S&P 500 (grey and green daily price candles) has been tracking to its historic December average (dark grey line on right-hand side of chart) so far this month.

This chart shows that today’s session, the 11th trading session of December, marks the low point of average returns for the month of December since 1957, which is the benchmark index’s inception as a 500-stock index.
While history does not always repeat, over the next seven trading days bulls will be looking for signs that history will at least rhyme with the S&P 500 consolidating ahead of a late-month rally.

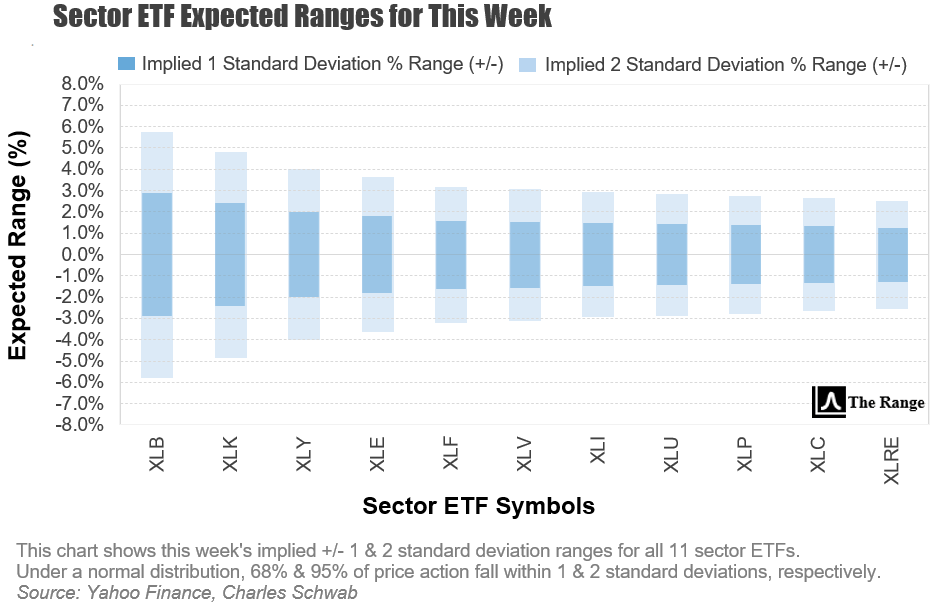
Looks like the basic materials (XLB) sector is expected to experience the most volatility over the coming week, with technology (XLK) once again taking the second-highest implied volatility position. Rounding out the top three sectors in terms of their implied five-day volatility outlook, is the consumer discretionary (XLY) sector.
At the opposite end of things, traders looking for lighter daily swings can look to the consumer staples (XLP), communication services (XLC), and real estate (XLRE) sectors.
ℹ️ WHY IS THIS IMPORTANT?
For options traders in particular: Implied volatility sets the tone for option prices. Understanding where large or small implied moves are priced in helps traders decide whether options are over- or under-valued before placing trades.

Monday
Homebuilder confidence index
Empire State manufacturing survey
Fed Speakers: Fed Governor Stephen Miran, New York Fed President John Williams
Top Earnings: Navan
Tuesday
U.S. employment report
U.S. retail sales, Business inventories, S&P flash U.S. Purchasing Managers Index (PMI)
Top Earnings: Lennar
Wednesday
Fed Speakers: Fed Governor Christopher Waller, New York President John Williams, Atlanta Federal President Raphael Bostic
Top Earnings: Micron Technology, Jabil, General Mills
Thursday
Consumer Price Index
Initial jobless claims, Philadelphia Fed manufacturing survey
Top Earnings: Accenture, Nike, Cintas, FedEx, Darden Restaurants, Birkenstock, CarMax, KB Home, BlackBerry
Friday
Existing-home sales
Consumer sentiment
Top Earnings: Paychex, Carnival, Conagra, Lamb Weston, Winnebago

As advertised, volatility—as measured by the Cboe Volatility Index (VIX)—witnessed a reflexive bounce early last week before settling back toward the low end of a multi-month range.
While this suggests daily market swings should remain close to the norms shown below, remaining vigilant for potential spurts of higher volatility is still prudent, as momentum behind falling volatility is slowing noticeably.

📝 EDITOR’S NOTE
Each day the market is open, we update our comprehensive performance charts on our website for you to view. In addition, be sure to follow us on X for timely intra-week updates.

📋Here’s a curated list of top value-added insights that uncover what’s happening way beyond the usual financial media headlines.

Please be sure to follow us on X.
If you like what we're doing, please forward us to a friend. If you're not already subscribed, join our growing family of free subscribers.
Reply