- The Range
- Posts
- Jobs Data and an Earnings Avalanche Meet Rising Volatility
Jobs Data and an Earnings Avalanche Meet Rising Volatility
👋 Hello and welcome to Monday! 🌅
Here’s what we’re watching this week:
Volatility is creeping higher, and the VIX is nearing a more unstable zone.
January jobs data takes center stage as the Fed watches for cracks in labor strength.
Earnings from Amazon and Alphabet headline a busy week for Big Tech investors.
AI signals arrive from AMD, Qualcomm, and Palantir, alongside Disney, Uber, Toyota, and pharma.
Let’s gooooo!🏎️🏇🏃♂️➡️

🔍 Jobs Report Takes the Spotlight
Friday’s January jobs report will be the week’s main gut check on the labor market. December hinted at some cooling: unemployment ticked down, but payroll growth came in softer than expected, with employers adding just 50,000 jobs.
The Fed is paying close attention. After holding rates steady last week amid lingering inflation concerns, officials are watching for signs that hiring is losing steam. Some policymakers have suggested more rate cuts could still be needed to support the job market.
Beyond jobs, investors will also track February consumer sentiment, consumer credit data, and fresh PMI readings on manufacturing and services activity.
💵 What’s the market pricing in for the week ahead?
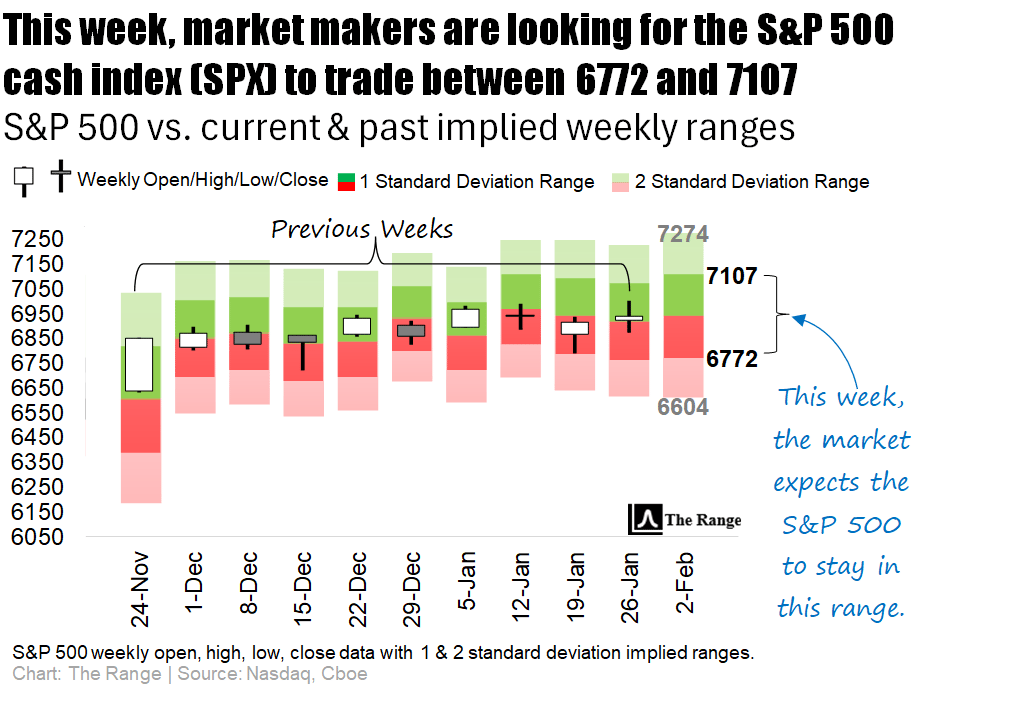
ℹ️ WHY IS THIS IMPORTANT?
Knowing what the implied weekly range is helps traders set expectations for what the likely trading limits will be. This can help prevent overreaction near quantified range extremes, while also providing perspective on whether there is still room for an intra-week rally or sell-off to run.
📝 Note: This same logic can also be applied to the “Where’s the Action At?” section below.
Click here 👈 to learn more about our charts.

📈 Big Earnings Week: Alphabet, Amazon, Disney, and Pharma
Earnings season stays busy with Alphabet and Amazon both reporting after strong recent quarters—Alphabet crossed the $100 billion revenue mark, while Amazon posted solid growth even as it announced another round of layoffs.
AMD’s report will be another AI pulse check, with demand for data center chips staying hot. Still, some analysts are starting to wonder if tech valuations are running a little too far ahead of fundamentals.
Disney will also be in focus, especially its streaming business, which grew last quarter but didn’t quite hit expectations.
And pharma is stepping into the spotlight too: Eli Lilly reports Wednesday as optimism around its weight-loss drugs keeps driving shares higher. Novo Nordisk, Amgen, Merck, AbbVie, and Novartis are also on deck.
🤔 Which companies are poised to possibly over- or underreact to earnings this week?
The largest company to report earnings this week, Amazon, has a history of trading close to or only slightly beyond the market makers’ expected range during the trading session immediately following earnings (keep reading below the next table for more details on how this is calculated).
Of the 20 largest companies reporting earnings this week, Eli Lilly has the strongest tendency to overshoot the implied price range immediately following earnings.
On the other side of the coin, of the top 20 companies reporting this week, Linde shows the greatest likelihood of staying inside its post-earnings expected range (keep reading below the next table for more details).
👇 Below is a look at this week’s biggest earnings reports, sorted by market cap:

HOW CAN TRADERS USE THIS INFORMATION?
For active traders looking to trade some of this week’s earnings plays, the highlighted columns on the table above show the implied (expected) post-earnings move for each company, along with the Average 1-Day Realized Volatility Post-Earnings Ratio (1D RV).
📈 Implied Move: The market’s best guess at how much a stock will swing after earnings.
📊 1D RV: A powerful tool that represents the post-earnings price move divided by the expected price move over the past 12 quarters. In other words, it measures how good (or bad) the market is at pricing each company’s earnings.
💵 When you see a ratio >1.0, it indicates that, historically, the earnings are mispriced and the stock moves MORE than the market anticipates, favoring straddle buyers.
🪝 A ratio <1.0 tells the opposite story, meaning the stock historically moves LESS than the market anticipates, which favors straddle sellers.
Happy hunting.

📉 Bitcoin’s ‘hopium’ for bulls may be over and this weekend’s slide could be just the beginning: After a sharp drop below $78K, analysts suggest Bitcoin’s recent optimism might’ve been wishful thinking, with more downside potentially on deck as technical indicators flip bearish. Read more
🏰 European Tech Giant Cuts Off U.S. Subsidiary After Multimillion Dollar ICE Contract: 🛰️Read more French IT giant Capgemini said it’s selling its U.S. subsidiary after questions over a controversial ICE surveillance contract sparked protests and political pressure on both sides of the Atlantic. Read more
🔋Foldable iPhone to Feature Unrivaled Battery Life: Rumors from leakers say Apple’s first foldable iPhone could pack a class-leading ~5,500 mAh battery, promising endurance that might outlast your last three failed gym days. Read more

Giphy
🇦🇪 UAE Sheikh Secretly Acquired 49% of Trump’s World Liberty Financial Days Before Inauguration: An Abu Dhabi-linked billionaire reportedly snapped up nearly half of Trump’s crypto firm just before he took office, raising eyebrows and crypto gossip hotter than a blockchain mining rig in summer. Read more
🎤 Trump Reportedly Bombed His Speech at Closed-Door Black Tie DC Dinner: At an invite-only Washington club dinner, President Trump’s humor apparently landed about as well as a whoopee cushion in church, with multiple jokes falling flat in front of DC’s elite. Read more

The Energy (XLE), Technology (XLK), and Materials (XLB) sectors are currently the market's high-octane outliers, sporting the highest implied volatility on the board. Next week, keep your eyes on XLE as global production updates hit the tape, while XLK investors will be glued to critical software earnings reports for AI clues. Meanwhile, all eyes are on XLB as key manufacturing data drops to signal global industrial demand.
If you prefer a smoother ride, look to the Consumer Staples (XLP), Health Care (XLV), and Industrial (XLI), which are rounding out the list as the lowest volatility anchors. For XLP, the big watch item next week is the latest consumer sentiment index to gauge household spending power. XLV traders are tracking regulatory headlines for major pharmaceutical breakthroughs, while XLI participants are monitoring freight and logistics data to see if the domestic supply chain is still humming.

ℹ️ WHY IS THIS IMPORTANT?
For options traders in particular: Implied volatility sets the tone for option prices. Understanding where large or small implied moves are priced in helps traders decide whether options are over- or under-valued before placing trades.

Monday
• ISM manufacturing PMI
• Federal Reserve Official Speaking: Atlanta Fed President Raphael Bostic
• Top Earnings: Palantir, Disney, Mizuho Financial
Tuesday
• Job openings
• Top Earnings: Advanced Micro Devices, Merck, Amgen, Pfizer, PepsiCo
Wednesday
• ADP employment
• Federal Reserve Officials Speaking: Gov. Lisa Cook
• ISM services PMI
• Top Earnings: Alphabet, Eli Lilly, AbbVie, Novartis, Novo Nordisk, Uber Technologies, Qualcomm
Thursday
• Initial jobless claims
• Top Earnings: Amazon, Philip Morris, Shell, ConocoPhillips, Bristol-Myers Squibb
Friday
• U.S. employment report
• Consumer sentiment - preliminary, Consumer credit
• Top Earnings: Toyota Motors

Volatility has been climbing steadily to start 2026, and anomalous daily price swings are on the rise.

As of Friday’s close, the VIX now sits in the 5th decile of all of its historical (post-1990) closing levels. This zone is defined by VIX levels of 16.1 to 17.6. Still considered a zone where normal stock market trading takes place, the VIX continues to ride its near-term moving averages higher.
Keeping in mind that the VIX is designed NOT as a predictor of the market’s direction over the next 30 days, but rather a measurement of the market’s outlook for future volatility, this uptrend leaves the door open to higher volatility.

To that point, while a push into the 6th decile (17.6 to 19.5) would likely lead to larger intra-day swings, historically, AVERAGE daily returns have been higher in the 5th decile than in the 6th. It’s when the VIX starts to move into the 7th decile (between 19.5 to 21.6) when returns start to deteriorate.


📋Here’s a curated list of top value-added insights that uncover what’s happening way beyond the usual financial media headlines.

Please be sure to follow us on X.
If you like what we're doing, please forward us to a friend. If you're not already subscribed, join our growing family of free subscribers.
Reply