- The Range
- Posts
- GameStop’s Back, Gas Prices Are Up, and Sentiment Is on Deck
GameStop’s Back, Gas Prices Are Up, and Sentiment Is on Deck
Earnings, oil, and consumer mood all collide in a headline-heavy week
👋 Hello and welcome to Monday! 🌅
Here’s what we’re watching:
Earnings and geopolitics remain market drivers this week
GameStop and AI-adjacent names headline a busy earnings calendar
Rising gas prices may weigh on already fragile consumer sentiment
Volatility remains stubbornly high
Let’s get going! 🏎️🛼🏃♂️➡️

🔍Meme stocks meet macro reality
It’s shaping up to be one of those weeks where micro meets macro. Earnings from a familiar meme stock headline the calendar, but the real backdrop is bigger: rising oil prices, Middle East tensions, and a fresh read on how consumers are feeling about it all.
Investors are also watching how tariffs and inflation pressures are filtering through the system. Friday’s consumer sentiment report could end up being the week’s most important data point. Confidence has already been soft, and now higher gas prices are adding another layer of pressure for households.
Earlier in the week, the import price index will help investors gauge how tariffs are feeding into inflation, especially after last week’s surprise jump in wholesale prices.
Add in jobless claims and productivity data, and you get a clearer picture of an economy that’s still growing—but with some mixed signals under the hood.
💵 What’s the market pricing in for the week ahead?
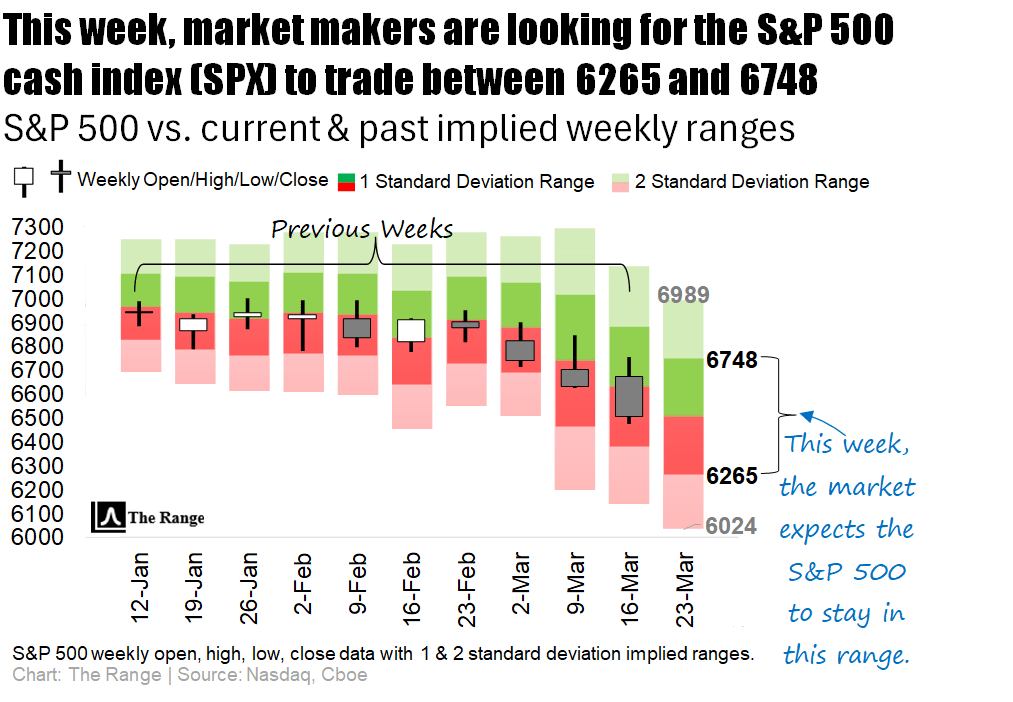
ℹ️ WHY IS THIS IMPORTANT?
Knowing what the implied weekly range is helps traders set expectations for what the likely trading limits will be. This can help prevent overreaction near quantified range extremes, while also providing perspective on whether there is still room for an intra-week rally or sell-off to run.
📝 Note: This same logic can also be applied to the “Where’s the Action At?” section below.
Click here 👈 to learn more about our charts.

📈 GameStop is back in focus
GameStop reports Tuesday, and the stock has quietly outperformed the broader market this year despite less-than-stellar fundamentals. A recent boost from high-profile investor interest has helped reignite attention, putting the original meme name back on traders’ radar.
Elsewhere, Chewy and Paychex step in with their own updates after a rough stretch for both stocks. And in a sign of where the market’s curiosity is shifting, Chinese robotaxi players Pony AI and WeRide will offer a glimpse into the next frontier of autonomous transport.
KB Home rounds things out with a housing check-in, arriving as the U.S. faces a multi-million home supply gap.
🤔 Which companies are poised to possibly over- or underreact to earnings this week?
The largest company to report earnings this week, PDD Holdings, has a history of trading well outside of the market makers’ expected range during the trading session immediately following earnings (keep reading below the next table for more details on how this is calculated).
Of the 20 largest companies reporting earnings this week, Cintas’ tendency to overshoot the implied price range immediately following earnings is greatest.
On the other side of the coin, of the top 20 companies reporting this week, KT shows the greatest likelihood of staying inside its post-earnings expected range (keep reading below the next table for more details).
👇 Below is a look at this week’s biggest earnings reports, sorted by market cap:
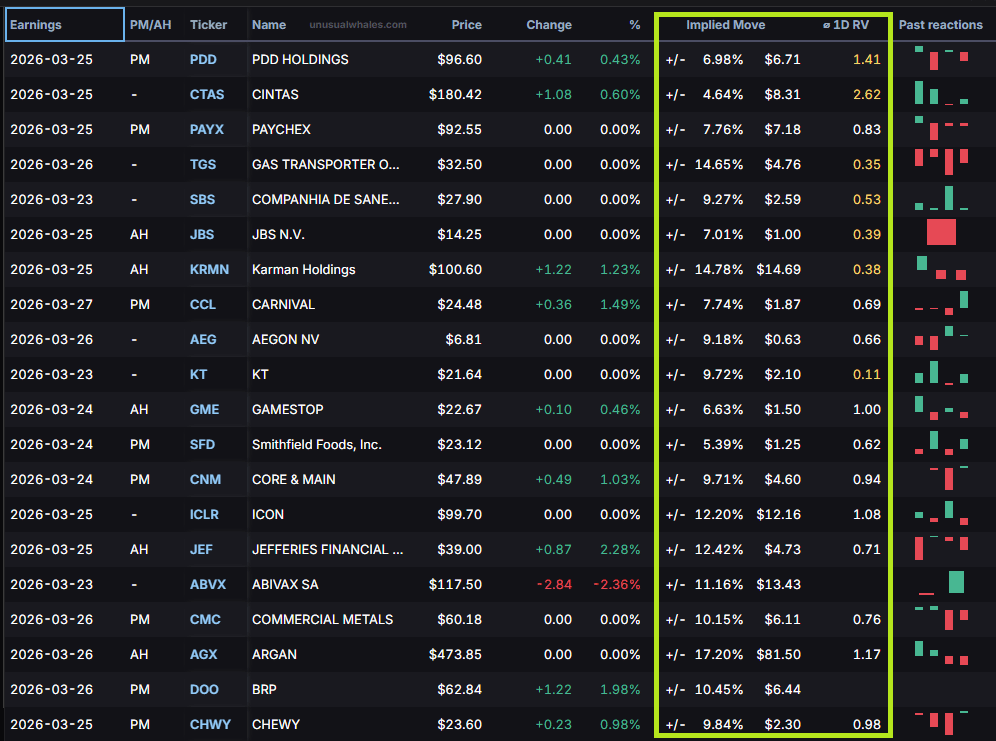
HOW CAN TRADERS USE THIS INFORMATION?
For active traders looking to trade some of this week’s earnings plays, the highlighted columns on the table above show the implied (expected) post-earnings move for each company, along with the Average 1-Day Realized Volatility Post-Earnings Ratio (1D RV).
📈 Implied Move: The market’s best guess at how much a stock will swing after earnings.
📊 1D RV: A powerful tool that represents the post-earnings price move divided by the expected price move over the past 12 quarters. In other words, it measures how good (or bad) the market is at pricing each company’s earnings.
💵 When you see a ratio >1.0, it indicates that, historically, the earnings are mispriced and the stock moves MORE than the market anticipates, favoring straddle buyers.
🪝 A ratio <1.0 tells the opposite story, meaning the stock historically moves LESS than the market anticipates, which favors straddle sellers.
Happy hunting.

🕵️♂️ Three Charged With Conspiring To Unlawfully Divert U.S. Artificial Intelligence Technology To China: Federal prosecutors say three men ran an elaborate “AI shell game,” allegedly using dummy servers, fake paperwork, and a pass-through company to sneak billions in export-controlled U.S. AI hardware to customers in China like it was Black Market Prime delivery. Read more
🎲 Nevada Bans Kalshi Prediction Market: Nevada slapped Kalshi with a restraining order that temporarily bans the prediction market from operating in the state, turning would-be election and econ bettors back to the old-fashioned way of guessing the future: yelling at cable news. Read more
🤖 AI may be helping more people start their own businesses, but is it also killing jobs?: Fortune reports that while AI tools are powering lean startups and “founderless unicorn” dreams, big firms like Block are citing automation as they slash headcount, leaving American workers wondering if their next boss will be human, a chatbot, or 13 people with really good agents. Read more

Gif by SeanbrowAi on Giphy
🏯 China's Premier Li pledges national treatment for foreign companies: Premier Li Qiang is pitching China as a “harbour of stability,” promising fair treatment, more imports, and a friendlier business climate for foreign firms even as global trade tensions make investors feel like they’re speed-dating with geopolitical risk. Read more
🚀 Elon Musk Twitter verdict misled investors before $44 billion purchase: A California jury found Elon Musk liable for misleading Twitter investors ahead of his $44 billion takeover, opening the door to potentially billions in damages and proving that his tweets can move more than just meme stocks—they can also summon lawyers. Read more

The energy sector (XLE) is expected to be the most volatile sector this week, with investors laser-focused on geopolitical headlines and whether supply disruptions push crude prices even higher next week. Next up, the technology sector (XLK) remains a hotspot as markets look for updates on AI spending trends and whether earnings momentum can justify recent leadership. Rounding out the top three, the industrials sector (XLI) is seeing elevated uncertainty tied to global growth expectations, with investors watching closely for any shifts in manufacturing data or trade developments.
At the other end of the spectrum, volatility is taking a breather. The health care sector (XLV) sits among the calmest, with attention turning to regulatory updates and drug pipeline news that could quietly shift sentiment. The utilities sector (XLU) continues to trade steadily, as investors monitor interest rate movements and their impact on yield-sensitive names. Meanwhile, the communications sector (XLC) rounds out the low-volatility group, with next week’s focus squarely on advertising trends and subscriber growth updates from major platforms.
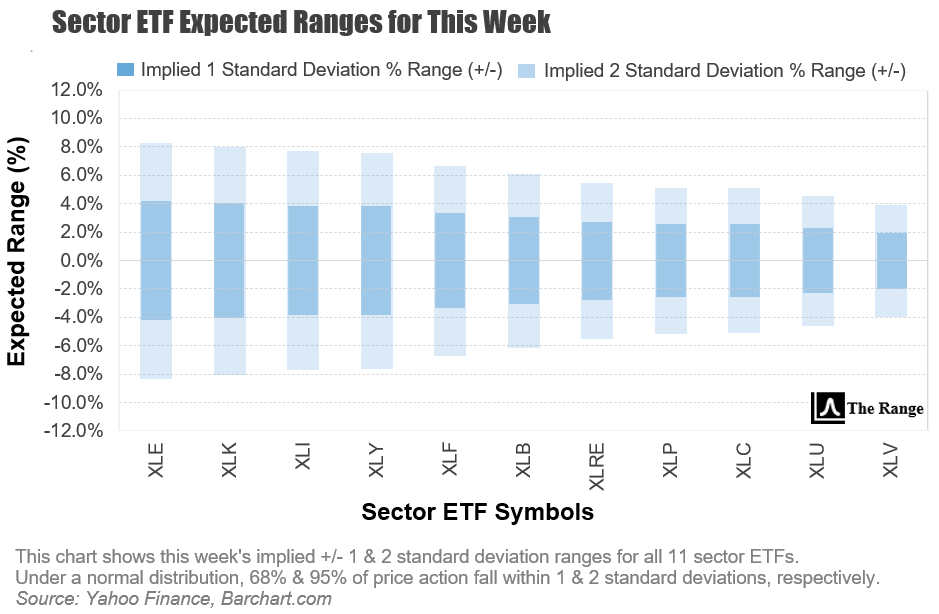
ℹ️ WHY IS THIS IMPORTANT?
For options traders in particular: Implied volatility sets the tone for option prices. Understanding where large or small implied moves are priced in helps traders decide whether options are over- or under-valued before placing trades.

Monday
Construction spending
Top Earnings: WeRide
Tuesday
U.S. productivity - revision
S&P flash U.S. Purchasing Managers Index (PMI)
Top Earnings: GameStop, Core & Main, Smithfield Foods, AAR Corp., KB Home
Wednesday
Import price index
Top Earnings: Paychex, Karman Holdings, Chewy, Jefferies Financial Group, Ondas
Thursday
Initial jobless claims
Top Earnings: Commercial Metals, Argan, Pony AI, BRP
Friday
Consumer sentiment
Top Earnings: Legence

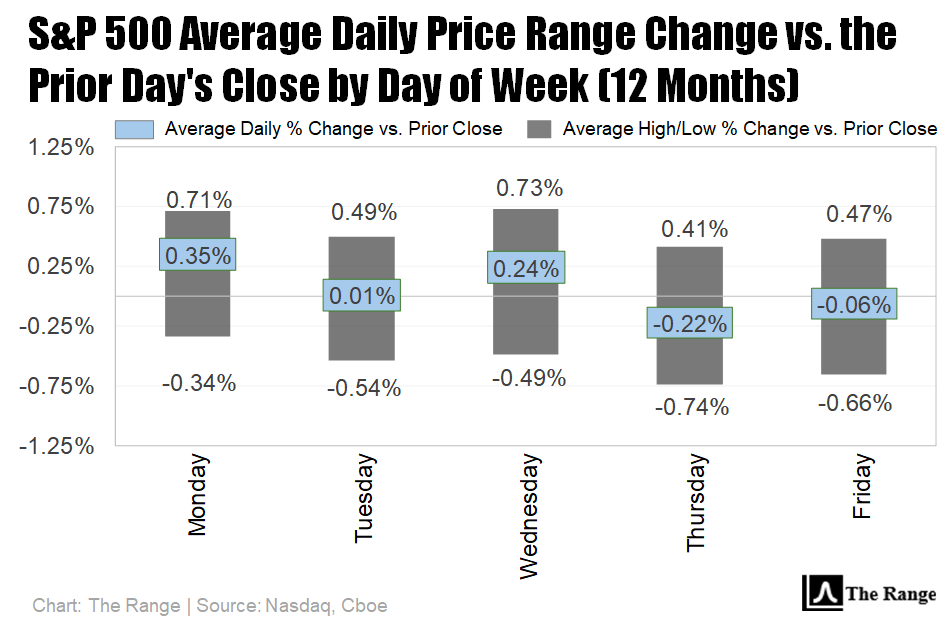
The Cboe Volatility Index notched its third straight close above 20 last week. It’s still below the early-March spike tied to Middle East tensions, but this is elevated territory. In other words, the S&P 500 may still be primed for larger-than-usual daily swings in the days ahead.
📝 EDITOR’S NOTE
Each day the market is open, we update our comprehensive performance charts on our website for you to view. In addition, be sure to follow us on X for timely intra-week updates.

📋Here’s a curated list of top value-added insights that uncover what’s happening way beyond the usual financial media headlines.

Gif by SkyTV on Giphy
Please be sure to follow us on X.
If you like what we're doing, please forward us to a friend. If you're not already subscribed, join our growing family of free subscribers.
Reply