- The Range
- Posts
- Fed Talk, VIX Pops, and a New Twist in Earnings Season
Fed Talk, VIX Pops, and a New Twist in Earnings Season
Markets wobble as Big Tech reports, volatility spikes, and the Fed grabs the mic
👋Hello and Happy Monday! 🌅
Here’s what’s on deck this week:
📈 Earnings blitz incoming: Palantir, Disney, and friends hit the mic.
📊 Data dump alert: Trade, credit, and services sentiment on deck.
🎤 Fed speakers week: Daly and Musalem headline the central bank circuit.
📉 VIX strength: Last week’s VIX pop points to a wobbly week ahead for stocks.
Let’s dive in.💦💦
Be sure to follow us on X for timely intra-week updates.

🗓️ Lighter week, louder Fed
The earnings and data docket may be thinner this week, but Fed speakers are stepping up to fill the void.
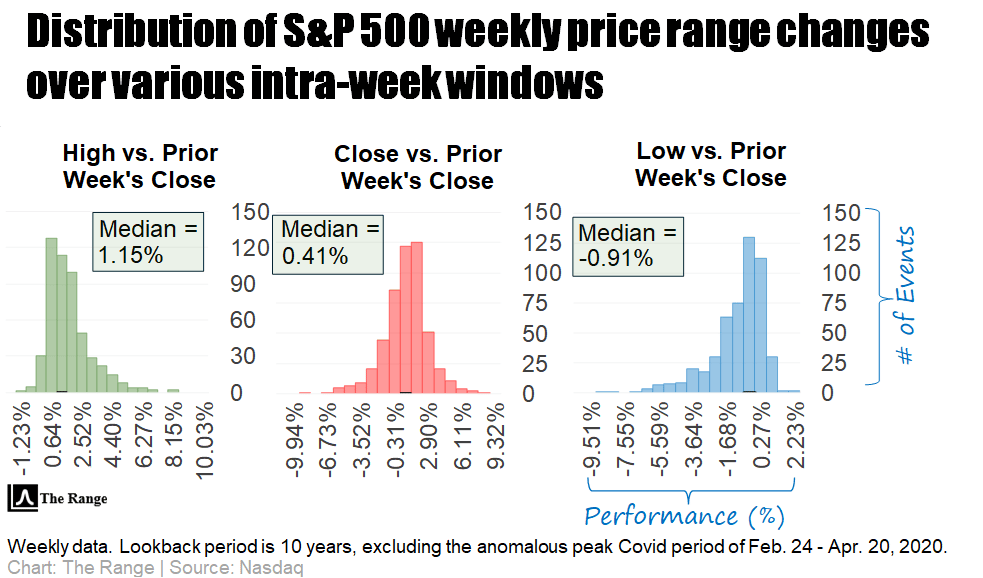
As the first chart below shows, the S&P 500’s expected range opens up a bit this week, to between 6417 and 6059.
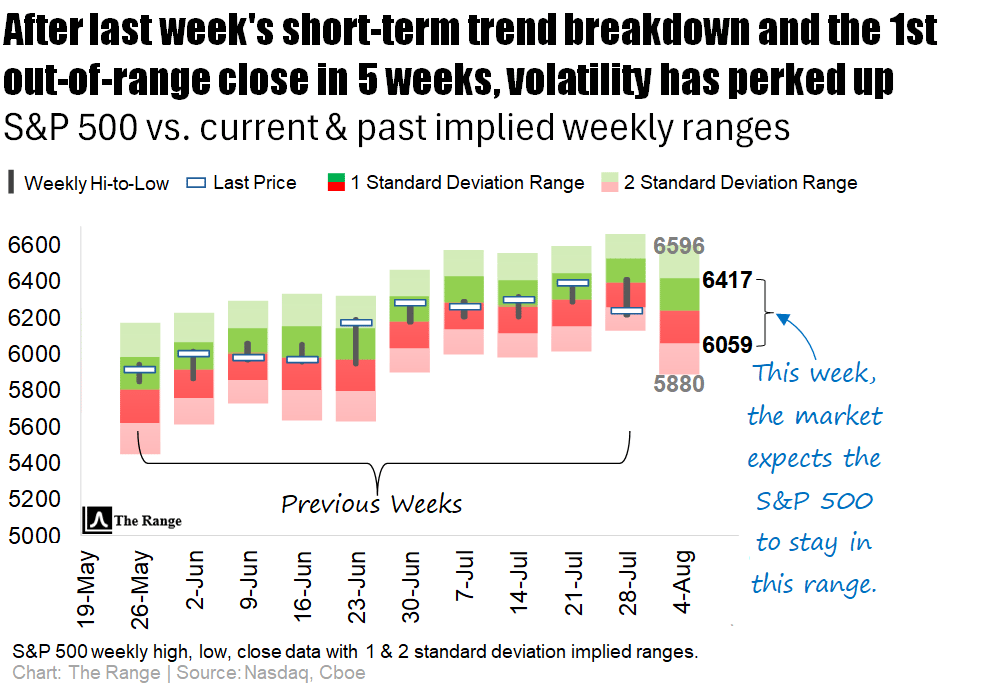
This follows last week’s small close below the implied range, which was the first implied range violation since the week of June 23rd.
Click here 👈to learn more about our charts.

So, what’s this week’s implied range already pricing in for the next 5 days?
📈 Earnings SZN marches on
After a fireworks show of earnings last week, the hits keep coming. Big Tech and consumer giants are up next: Palantir, AMD, and Uber will headline the tech block, while McDonald’s and Disney bring the heat from the golden arches and the Magic Kingdom. Pharma heavyweights Novo Nordisk, Amgen, Pfizer, and Eli Lilly round out the slate with fresh updates from the drugstore aisle.
🌍 Trade wars & tariff tales
New U.S. trade deficit data drops this week—just as tariffs are shaking up global supply chains. Keep an eye on factory orders, too, which could hint at whether the U.S. manufacturing engine is finally revving up. Last week, tariff jitters and jobs data dragged markets into the red, ending July with a fizzle.
💳 Debt check & Fed speak
Consumer credit figures out later this week will reveal if Americans are swiping more—or tightening their belts. And Fed officials are back on the mic after pausing rate hikes last week, so prepare for more dot-plot decoding.

The VIX popped to its highest level since late June on Friday, just as the S&P 500 slipped into a short-term downtrend. That nudged the longer-term trend from “strong uptrend” to just plain “uptrend” (still good, just a little less spicy).
History says there’s a 69% chance the S&P closes within its expected range this week—so buckle up, but maybe don’t panic.


Here’s what to expect from earnings this week:
📊 Earnings-palooza, kickoff edition:
Palantir (PLTR) gets the ball rolling Monday as it rides an AI high, still trading near record levels. Next up: AMD (Tuesday), where Wall Street will be eyeing its MI350 chips to see if they can finally stand toe-to-toe with Nvidia. Uber (Wednesday) also hits the stage, and analysts are feeling bullish.
🍔 Big Macs, Big Questions:
McDonald’s (MCD) reports Wednesday amid slowing visits from middle-income diners—not exactly the Happy Meal investors were hoping for. Same day, Disney (DIS) will look to build on last quarter’s good vibes after raising its profit outlook and boosting streaming subs.
💊 Weight-loss winners? Maybe not:
Novo Nordisk (NVO) steps on the scale Wednesday after trimming its full-year outlook thanks to slowing Ozempic and Wegovy sales. Eli Lilly (LLY) wraps up the week Thursday—investors are watching closely after May’s profit cut tied to ballooning R&D costs.

👇 Below, we’ve got a cheat sheet of this week’s biggest names reporting, sorted by market cap (source: Unusual Whales).
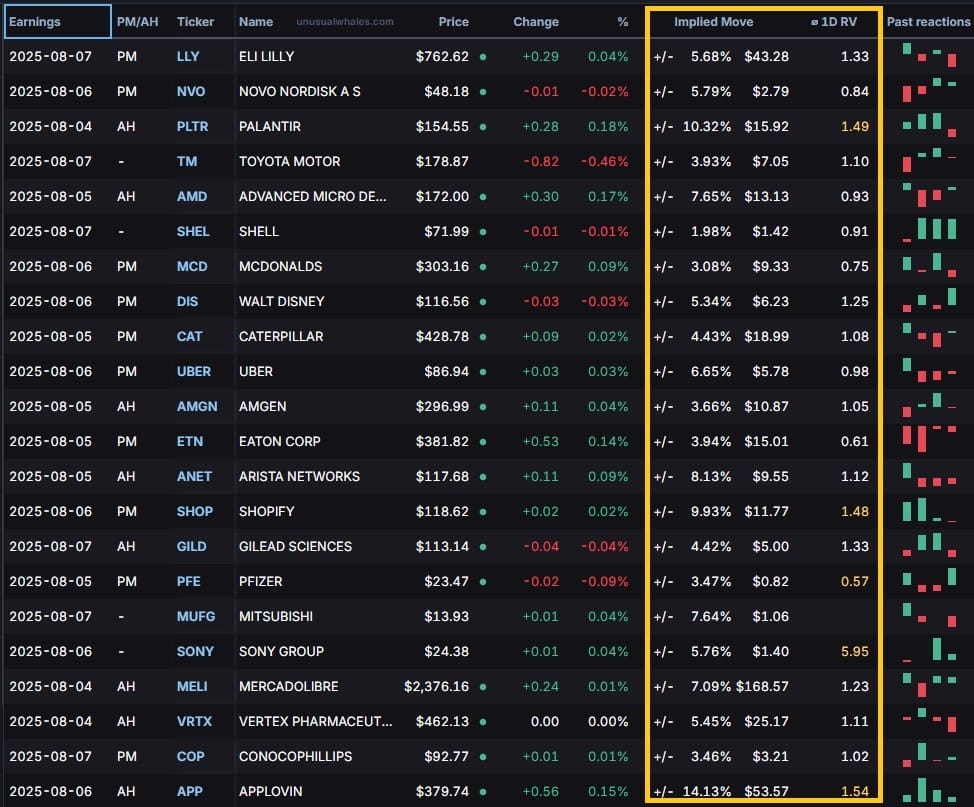
For active traders looking for actionable insights, the highlighted columns show the implied (expected) post-earnings move for each company, along with the Average 1-Day Realized Volatility Post Earnings Ratio (1D RV).
📈Implied Move: The market’s best guess at how much a stock will swing after earnings.
📊1D RV: A powerful tool that represents the post-earnings price move divided by the expected price move over the past 12 quarters. In other words, it measures how good (or bad) the market is at pricing each company’s earnings.
💵When you see a ratio >1.0, indicates that, historically, the earnings are mispriced and the stock moves MORE than the market anticipates, favoring straddle buyers.
🪝A ratio <1.0 tells the opposite story, meaning the stock historically moves LESS than the market anticipates, which favors straddle sellers.
Happy hunting.

Last Week’s VIX Pop Points to a Wobbly Week for Stocks
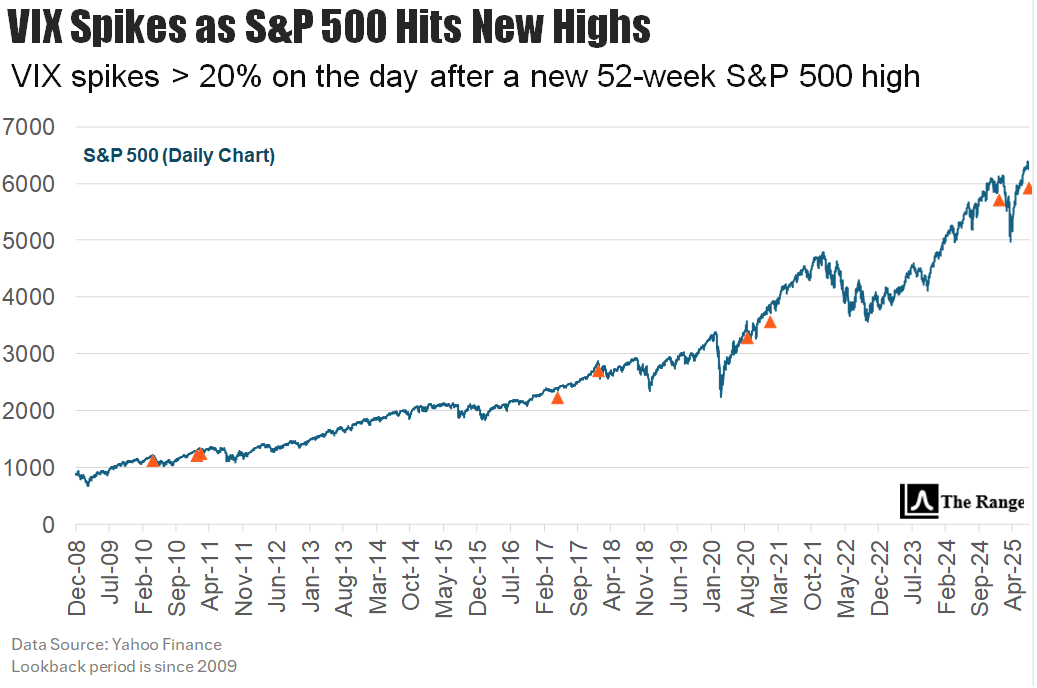
Last week’s jam-packed calendar ended with a bang—and a spike of 21.9% on Friday alone. The VIX notched its biggest weekly jump since the tariff tantrum back in March.
As this next chart shows, since 2009, we’ve seen 8 prior instances when the VIX surged more than 20% on the day following a new 52-week high by the S&P 500, just like it did last Thursday.
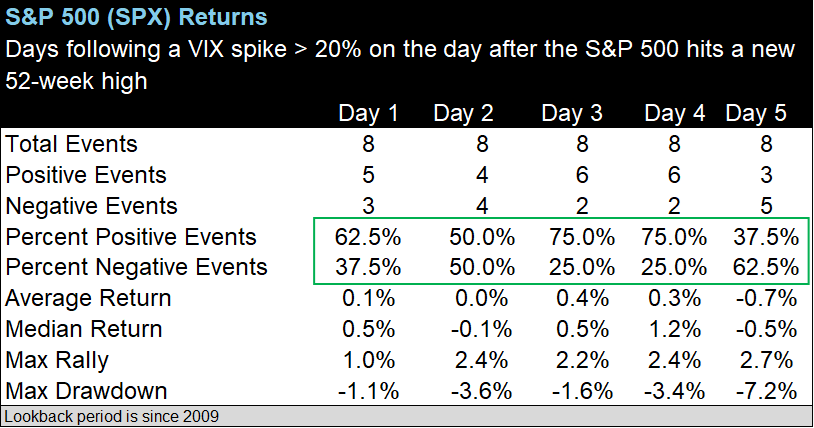
While history shows that similar instances have resulted in the S&P 500 being higher 1, 3 and 4 days following such VIX spikes, the S&P 500 has tended to be lower by day 5.

🛢️ OPEC makes another large oil output hike in market share push: OPEC just turned the oil tap up again, boosting production in a move that smells like a full-on market share turf war. This comes despite weaker global demand and a growing fleet of Teslas on every block. Basically, OPEC's motto seems to be: “If demand won’t rise, we’ll just flood the place.” Read more
📉 US job growth slows in July, unemployment steady at 4.0%: The US job market hit cruise control in July, adding fewer jobs than expected and keeping the unemployment rate at a stubborn 4.0%. Employers seem to be cautiously tapping the brakes, waiting to see if the Fed will do the same. It’s not a full-blown slowdown, but definitely no Red Bull-fueled hiring spree. Read more
⚡ The US Is Falling Behind in the Global EV Race: While China and Europe are lapping the track in sleek electric rides, the US is still stuck in the EV pit stop. Supply chains, infrastructure, and policy hiccups are holding back America's EV ambitions like a parking boot. If this were Mario Kart, the US just slipped on its own banana peel. Read more

Gif by Zion_Animations on Giphy
🧀 Berkshire takes Kraft Heinz writedown: Warren Buffett’s Berkshire Hathaway just admitted it may have overpaid for the ketchup and mac & cheese empire, Kraft Heinz. The company took a big ol' bite of humble pie with a writedown that’ll leave a sour aftertaste. Maybe next time they'll stick to snacks that don’t spoil on the balance sheet. Read more
🤖 AI Bullishness Is Soaring, But Pros See Trouble Ahead: Everyone’s talking AI like it’s the second coming of sliced bread—but some Wall Street pros are already seeing smoke signals. Analysts warn the AI boom may be skipping the “proof of concept” phase and diving headfirst into “bubble bath.” Basically, it’s all fun and games until ChatGPT starts asking for a raise. Read more

With the CBOE Volatility Index (VIX) on the rise again, weekly price moves run the risk of becoming larger than what has been the norm of late.
Click here 👈to learn more about our charts.

EDITOR’S NOTE
Each day the market is open, we update our comprehensive daily performance charts on our website for you to view. In addition, be sure to follow us on X for timely intra-week updates.

Monday
Data to Watch: Factory orders (June)
Key Earnings: Palantir, Vertex Pharmaceuticals, Williams Cos., Axon Enterprise
Tuesday
U.S. trade deficit (June)
Key Earnings: Advanced Micro Devices, Caterpillar, Amgen, Eaton Corp., Arista Networks, Pfizer, BP
More Data to Watch: S&P final U.S. services PMI (July), ISM services PMI (July)
Wednesday
Fed Representative Speaking: San Francisco Fed President Daly
Key Earnings: Novo Nordisk, McDonald’s, Walt Disney, Uber Technologies, Shopify, Sony Group, Applovin, DoorDash, Airbnb
Thursday
Initial jobless claims (Week ending Aug. 2)
Fed Representative Speaking: Atlanta Fed President Bostic
Key Earnings: Eli Lilly, Gilead Sciences, ConocoPhillips, Constellation Energy, Motorola Solutions, Monster Beverage
More Data to Watch: U.S productivity (Q2), Wholesale inventories (June), Consumer credit (June)
Friday
Fed Representative Speaking: St. Louis Fed President Musalem

Below is our curated list of top value-added insights that uncover what’s happening way beyond the usual financial media headlines.
3 times in 25 years the Buffett Indicator peaked above 1.7x
What happened next:
Peak 1 → Dot-com bubble burst (-78%)
Peak 2 → Financial crisis (-42%)
Peak 3 → 2022 tech wreck (-33%)Peak 4 is here. And it’s the highest yet.
— Katusa Research (@KatusaResearch)
2:09 PM • Aug 2, 2025
$ndx $spx #engulfing NDX Weekly outside bar down -higher high (actually highest in 6-months in study below), close below previous week's.
— Nautilus Research (@NautilusCap)
6:51 PM • Aug 2, 2025
🚨UNPRECEDENTED:
Nvidia and Microsoft make up ~15% of the S&P 500's market cap.
By comparison, the COMBINED weight of consumer staples, energy, healthcare, and utilities is just 19.7%.
At the Dot-Com Bubble peak, these sectors accounted for 21.6%.👇
— Global Markets Investor (@GlobalMktObserv)
4:57 PM • Aug 3, 2025
PumpFun isn’t losing steam, the market around it is just evolving.
It still accounts for 1 in 5 new tokens on @solana, even as a wave of new launchpads enter the scene.
That kind of staying power, after nearly a year at the top, is rare in crypto.
As the ecosystem fragments,
— Milk Road (@MilkRoadDaily)
7:15 PM • Aug 2, 2025
1/3
Something happened in the last few years that has led to larger, more volatile revisions.My version of the repost chart, with a similar trendline. It improved with the use of better sampling techniques, as labeled.
But in 2022, the revisions started to increase again.
— Jim Bianco (@biancoresearch)
4:42 PM • Aug 3, 2025

Please be sure to follow us on X.
If you like what we're doing, please forward us to a friend. If you're not already subscribed, join our growing family of free subscribers.
Reply