- The Range
- Posts
- Fed Day Meets Big Tech Earnings: Buckle Up
Fed Day Meets Big Tech Earnings: Buckle Up
Microsoft, Meta, Tesla, and Apple test the market’s AI optimism.
👋 Hello and welcome to Monday! 🌅
Here’s what we’re watching this week:
Traders expect the Fed to stay put, but Powell’s words could move markets.
Big Tech earnings kick off, putting the AI hype train to the test.
Mega-cap results double as a gut check on the broader economy.
The S&P 500 has traded within its expected range for eight straight weeks.
Let’s get going.⛷️❄️🛷

The Fed kicks off 2026 with a big “will-they-or-won’t-they” moment
On Wednesday, the Federal Reserve delivers its first interest-rate decision of the year—and while markets don’t expect a move, they’ll be hanging on every word from Chair Jerome Powell.
After cutting rates three meetings in a row, Fed officials have signaled they want more proof inflation is cooling and the labor market isn’t overheating before doing anything else. That caution showed up in last week’s inflation data, which came in warmer than hoped and helped cement expectations that rates stay put—for now.
Beyond the Fed, investors will also digest a grab bag of delayed economic updates this week, including wholesale inflation data and a fresh look at the U.S. trade balance.
💵 After eight consecutive weeks of trading within the expected range, what’s the market pricing in for the week ahead?

ℹ️ WHY IS THIS IMPORTANT?
Knowing what the implied weekly range is helps traders set expectations for what the likely trading limits will be. This can help prevent overreaction near quantified range extremes, while also providing perspective on whether there is still room for an intra-week rally or sell-off to run.
📝 Note: This same logic can also be applied to the “Where’s the Action At?” section below.
Click here 👈 to learn more about our charts.

📈 Earnings season is about to hit hyperdrive
Several Magnificent Seven heavyweights step into the spotlight midweek, with Microsoft, Meta, and Tesla reporting Wednesday, followed by Apple on Thursday.
Microsoft reports as its stock struggles out of the gate in 2026. Tesla faces tougher questions as vehicle deliveries cool and investors search for the next growth engine. Meta’s report should shed more light on its AI ambitions as it continues to downplay the metaverse era. And Apple’s earnings arrive just days after announcing a high-profile AI partnership—setting the stage for big expectations.
Add in results from major names across telecom, industrials, autos, and finance, and you’ve got a week that could reset the market’s tone for the rest of January.
🤔 Which companies are poised to possibly over- or underreact to earnings this week?
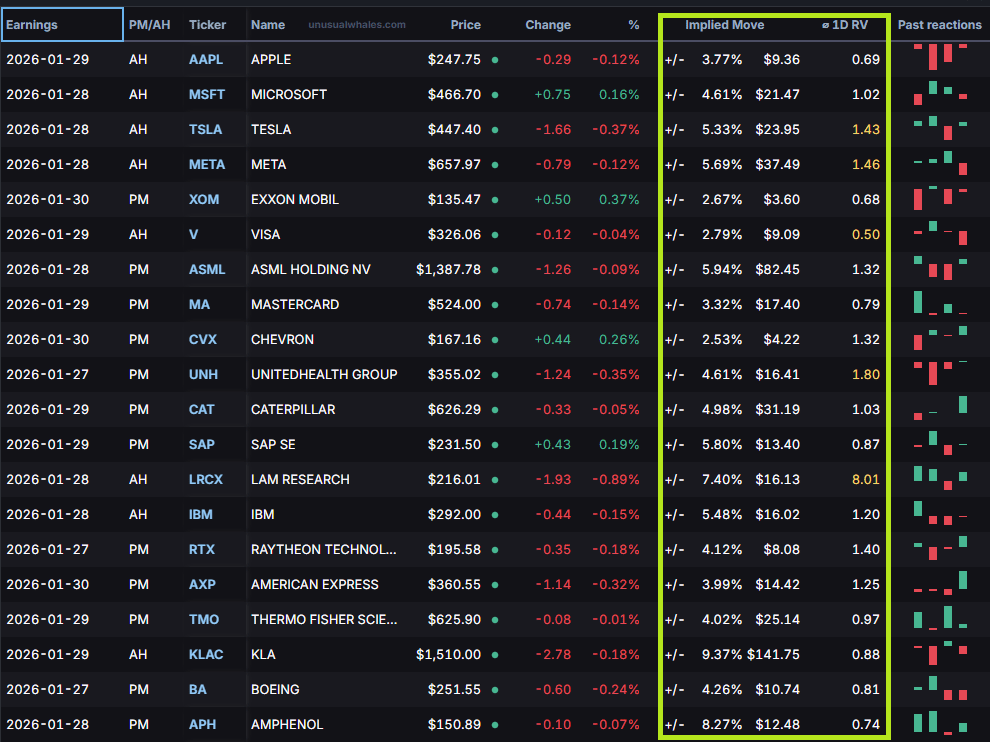
The largest company to report earnings this week, Apple, has a history of trading well within the market makers’ expected range during the trading session immediately following earnings (keep reading below the next table for more details on how this is calculated).
Of the 20 largest companies reporting earnings this week, Lam Research has the strongest tendency BY FAR to overshoot the implied price range immediately following earnings.
On the other side of the coin, of the top 20 companies reporting this week, Exxon Mobil shows the greatest likelihood of staying inside its post-earnings expected range (keep reading below the next table for more details).
👇 Below is a look at this week’s biggest earnings reports, sorted by market cap:
HOW CAN TRADERS USE THIS INFORMATION?
For active traders looking to trade some of this week’s earnings plays, the highlighted columns on the table above show the implied (expected) post-earnings move for each company, along with the Average 1-Day Realized Volatility Post-Earnings Ratio (1D RV).
📈 Implied Move: The market’s best guess at how much a stock will swing after earnings.
📊 1D RV: A powerful tool that represents the post-earnings price move divided by the expected price move over the past 12 quarters. In other words, it measures how good (or bad) the market is at pricing each company’s earnings.
💵 When you see a ratio >1.0, it indicates that, historically, the earnings are mispriced and the stock moves MORE than the market anticipates, favoring straddle buyers.
🪝 A ratio <1.0 tells the opposite story, meaning the stock historically moves LESS than the market anticipates, which favors straddle sellers.
Happy hunting.

📈 Power prices surge as winter storm spikes demand in US data center alley: Electricity markets turned into WrestleMania as a brutal winter storm hammered grids from the Mid-Atlantic to New England, outages spiked and power prices rocketed — especially where data centers slurp juice like it’s Red Bull — leaving utilities begging for conservation as the cold hangs on. Read more
⚒️ US to inject $1.6 billion into rare earths miner for 10% stake, FT reports: The U.S. government is teeing up a $1.6 billion investment to snatch a 10% stake in Oklahoma-based USA Rare Earth as part of a broader push to bring critical minerals home, aiming to cut China out of the rare earths supply chain while quietly giving mining stocks a reason to party. Read more
💲Schwab and Robinhood Will Match U.S. Government’s $1,000 Gift to Trump Accounts: Charles Schwab and Robinhood are pledging to match the U.S. government’s $1,000 seed payment into Trump Accounts for employees’ eligible newborns, doubling the baby savings kickoff and turning infancy into a tiny Wall Street bull run. Read more

Giphy
🤖 Apple will reportedly unveil its Gemini-powered Siri assistant in February: Apple’s Siri is finally ditching basic answers and embracing big brains via Google’s Gemini AI, with a shiny new assistant set for a February debut — because sometimes outsourcing genius is the only way forward. Read more
🧠 Google AI Overviews cite YouTube more than any medical site for health queries, study suggests: A German research study found that Google’s AI “Overviews” lean on YouTube far more than trusted health research sites when answering medical questions — a quirky but worrying clue that your video binge might be shaping your health advice more than your doctor. Read more

Energy (XLE), Technology (XLK), and Materials (XLB) lead the list with the highest implied volatility, signaling high market expectations for price movement. This week, investors will be watching crude inventory data for XLE, AI-driven earnings growth for large tech companies in XLK, and copper price swings amidst a supply deficit for XLB.
The sectors with the lowest implied volatility are Consumer Staples (XLP), Health Care (XLV), and Industrials (XLI). For XLP, the focus is on upcoming inflation data to gauge consumer strength. XLV investors are watching if the sector can maintain its defensive position, while XLI participants monitor specific firm results for signs of a continued economic rally.

ℹ️ WHY IS THIS IMPORTANT?
For options traders in particular: Implied volatility sets the tone for option prices. Understanding where large or small implied moves are priced in helps traders decide whether options are over- or under-valued before placing trades.

Monday
Durable-goods orders
Top Earnings: Nucor, Ryanair, Brown & Brown, W.R. Berkley, Steel Dynamics
Tuesday
Consumer confidence
Top Earnings: UnitedHealth Group, RTX, Boeing, Texas Instruments, NextEra Energy, Union Pacific, HCA Healthcare, Northrop Grumman, United Parcel Service, General Motors
Wednesday
FOMC interest rate decision
Fed Chair Jerome Powell press conference
Top Earnings: Microsoft, Meta, Tesla, ASML Holdings, International Business Machines, GE Vernova, AT&T, ServiceNow, Progressive, Starbucks
Thursday
U.S. trade deficit
Wholesale inventories, Factory orders, Initial jobless claims
Top Earnings: Apple, Visa, Mastercard, Caterpillar, SAP, Thermo Fisher Scientific, Honeywell, Lockheed Martin, Blackstone
Friday
Producer price index
Top Earnings: Exxon Mobil, Chevron, American Express, Verizon, Colgate-Palmolive

Not surprisingly, last weekend’s early tariff-induced volatility spike caused the S&P 500 to trade outside its normal daily ranges during three out of last week’s four trading sessions.
Although the tariff situation has now deescalated and the Cboe Volatility Index (VIX) has retreated from last week’s high of 21.0 to Friday’s close of 16.1, historically, seeing the VIX positioned above the 16 level means that equity investors are still a bit on edge and are seeking downside insurance.
When we add in the fact that the VIX is now finding support at its rising 21-day moving average (this is basically a summary of the last month’s closing VIX levels), we’re faced with another week that starts with the potential for daily movement beyond the past year’s norms shown below.

📝 EDITOR’S NOTE
Each day the market is open, we update our comprehensive performance charts on our website for you to view. In addition, be sure to follow us on X for timely intra-week updates.

📋Here’s a curated list of top value-added insights that uncover what’s happening way beyond the usual financial media headlines.

Please be sure to follow us on X.
If you like what we're doing, please forward us to a friend. If you're not already subscribed, join our growing family of free subscribers.
Reply