- The Range
- Posts
- Delayed GDP Finally Drops as Volatility Presses One-Year Lows
Delayed GDP Finally Drops as Volatility Presses One-Year Lows
A shortened week brings GDP clarity and calm volatility
👋Hello and Welcome to Monday! 🌅
🎅Here’s what we’re watching during this holiday-shortened week:
Delayed GDP finally drops, compressing the BEA’s usual three-report timeline.
Tuesday brings a backlog blitz: GDP, durable goods, and Fed production data.
Consumer confidence and jobless claims test whether labor cracks are spreading.
Low volatility meets the market’s most bullish calendar window.
Let’s get going. 🦌🦌🦌

☕ Manufacturing and consumer data hit all at once
The holiday-shortened week is bringing a data dump that’s been stuck in government-shutdown limbo. At the top of the list: a long-awaited look at third-quarter GDP, finally dropping Tuesday after missing its original October release date.
Because of the shutdown backlog, this won’t be the usual GDP trilogy. Instead, the Bureau of Economic Analysis is skipping straight to a slimmed-down schedule—just two estimates and a final reading in January. Investors will be watching closely, especially after Q2 growth snapped back to a strong 3.8%, helped by a rebound from tariff-driven import distortions earlier in the year.
Tuesday is shaping up to be busy beyond GDP. October durable goods orders, plus delayed industrial production and capacity utilization data for October and November, all hit at once—giving markets a clearer picture of how manufacturing held up late in the year.
On the sentiment side, December consumer confidence arrives on time, offering a real-time check on how households are feeling heading into year-end. Weekly jobless claims follow Wednesday, drawing extra attention after last week’s report showed unemployment ticking higher.
💵What’s the market pricing in for the week ahead?
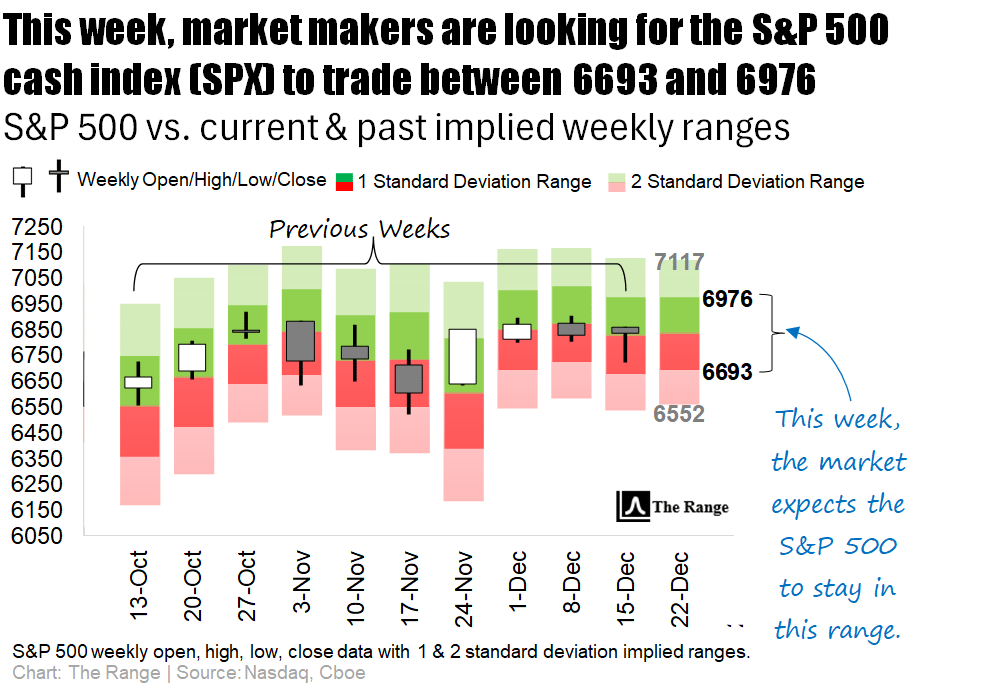
ℹ️ WHY IS THIS IMPORTANT?
For both stock and options traders: Knowing what the implied weekly range is helps set expectations for what the likely trading limits will be. This can help prevent overreaction near quantified range extremes, while also informing the traders on whether there is still room for an intra-week rally or sell-off to run.
📝 Note: This same logic can also be applied to the “Where’s the Action At?” section below.
Click here 👈 to learn more about our charts.

🎅🎅It’s a quiet week for earnings. Enjoy the time off.

Gif by laff_tv on Giphy

🥃 Jim Beam pauses production as tariffs bite: America’s favorite bourbon is hitting pause as tariffs squeeze costs, proving even whiskey needs to sober up when trade policy gives it a hangover. Read more
🤖 Waymo suspends service in San Francisco as robotaxis stall during blackout: Waymo’s self-driving cars temporarily tapped out in San Francisco after a blackout, reminding us that even robots can’t drive in the dark. Read more
✈️ Louisiana holiday travel breaks records as Christmas rush hits: Louisiana just clocked record-setting holiday travel numbers, as travelers packed planes and highways with the determination of people who really want that home-cooked meal. Read more

Giphy
🏦 China leaves benchmark lending rates unchanged for seventh month in a row: China’s central bank kept rates steady again, signaling a “wait and see” approach that’s starting to look more like “wait, wait, wait.” Read more
🍎 Italy’s antitrust fines Apple for alleged abuse of dominant position with App Store: Italy slapped Apple with an antitrust fine over App Store practices, showing regulators are still very much in a core-to-the-center mood. Read more

This week, the consumer staples (XLY) sector is expected to host the most volatility, with the basic materials (XLB) and technology (XLK) sectors showing the next highest levels of implied volatility.
At the quieter side of the spectrum, the real estate (XLRE), consumer staples (XLP), and healthcare (XLV) sectors are showing the lowest implied volatility.

ℹ️ WHY IS THIS IMPORTANT?
For options traders in particular: Implied volatility sets the tone for option prices. Understanding where large or small implied moves are priced in helps traders decide whether options are over- or under-valued before placing trades.

Monday
Quiet day, nothing scheduled
Tuesday
Gross Domestic Product - initial estimate
Durable-goods orders, Industrial production & capacity utilization, Consumer confidence
Wednesday
Initial jobless claims
Stock markets close at 1 p.m. EST; bond markets close at 2 p.m.
Thursday
Stock and bond markets closed for Christmas
Friday
Quiet day, nothing scheduled

As expected, the Cboe Volatility Index (VIX) did witness an oversold bounce last week, pushing the S&P 500 to overshoot its normal daily range during most trading sessions.
Volatility faded quickly into week’s end, sending the VIX back to the low end of its one-year range. And with no clear signs that the recent slide in volatility is slowing—plus the arrival of the market’s most bullish seasonal window (the last five trading days of the year through the first two of the next)—a further cooldown in volatility this week wouldn’t be surprising.

📝 EDITOR’S NOTE
Each day the market is open, we update our comprehensive performance charts on our website for you to view. In addition, be sure to follow us on X for timely intra-week updates.

📋Here’s a curated list of top value-added insights that uncover what’s happening way beyond the usual financial media headlines.

Please be sure to follow us on X.
If you like what we're doing, please forward us to a friend. If you're not already subscribed, join our growing family of free subscribers.
Reply