- The Range
- Posts
- AI Earnings Take Over Wall Street—But Credit Markets Hold the Real Clue
AI Earnings Take Over Wall Street—But Credit Markets Hold the Real Clue
CoreWeave, Oklo, Cisco, and AMD dominate the headlines, but junk bond spreads may decide whether the S&P’s post-April rally continues or cracks.
👋Hello and Welcome to Monday! 🌅
Here’s what’s on deck this week:
Bond markets close Tuesday for Veterans Day; stock markets stay open.
Despite the weekend of deal-making in Washington, the focus remains on earnings amid ongoing economic data delays.
Disney, CoreWeave, Sony, Cisco, and Applied Materials report this week.
Small business optimism survey may show pressure from rising costs.
Treasury budget report gives fresh insight into tariff revenue.
Let’s dive in!💦💦

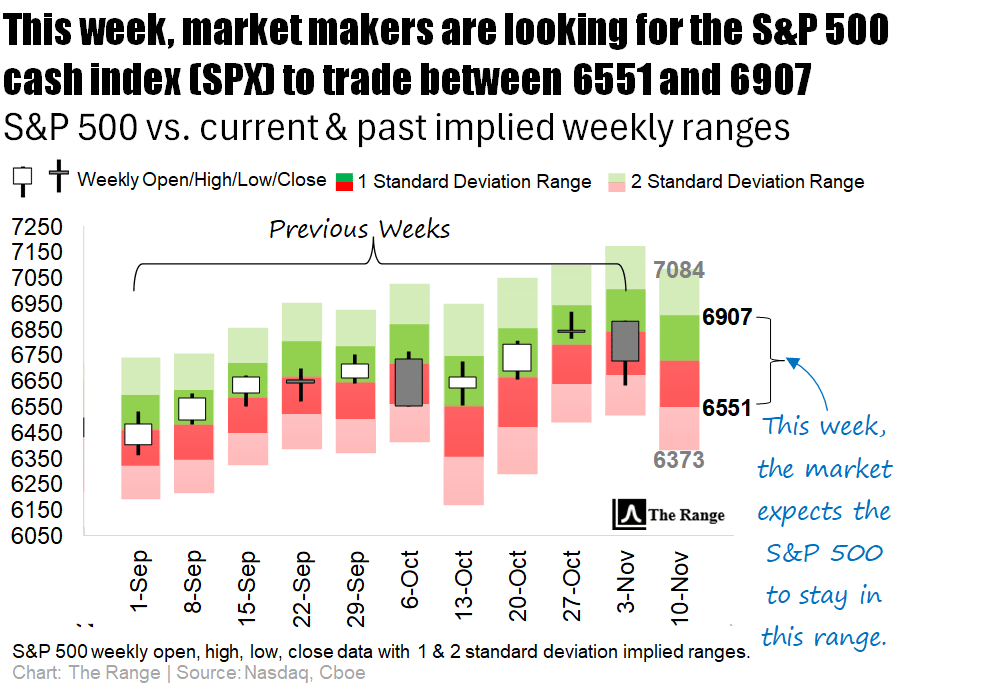
💵What’s the market pricing in for the week ahead?
Grab your coffee and your calendar…
Because of the Veterans Day holiday, bond traders get a four-day week, while equity traders grind on as usual.
Markets are higher this morning amid optimism that the 39-day US shutdown could soon come to an end, after a weekend of deal-making in Washington. As of now, though, several key economic reports remain delayed, shifting investors’ attention to something Wall Street never stops caring about: earnings.
Big names step onto the earnings stage—Disney, CoreWeave, Sony, Cisco, and Applied Materials—giving everyone something to argue about on X.
Also on deck: a reading on small business optimism—showing how rising costs may be squeezing mom-and-pop shops—and the Treasury’s monthly budget report, which hints at how much revenue the U.S. is pulling in from tariffs.
ℹ️ WHY IS THIS IMPORTANT?
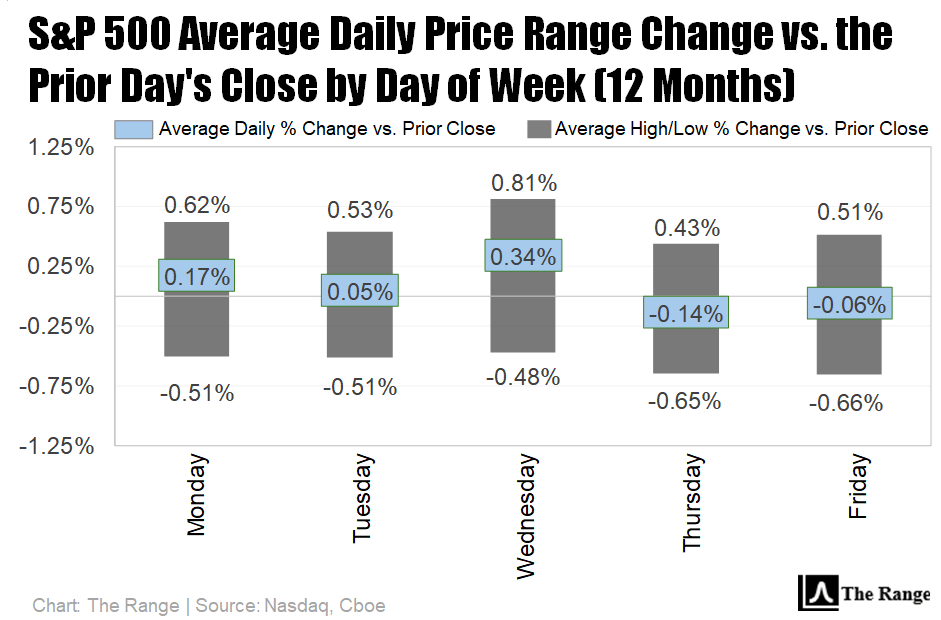
For both stock and options traders: Knowing what the implied weekly range is helps set expectations for what the likely trading limits will be. This can help prevent overaction near quantified range extremes, while also informing the traders as to whether there is still room for an intra-week rally or sell-off to run.
📝 Note: This same logic can also be applied to the “Where’s the Action At?” section below.
Click here 👈to learn more about our charts.

AI is still the main character in the markets—and CoreWeave is kicking off the week as the opening act. The data-center upstart, which went public earlier this year, has already pulled off the stock market version of a glow-up: shares have more than doubled. Thanks to partnerships with Nvidia (AI silicon royalty) and Meta (king of targeted ads and questionable bracelets), investors are betting CoreWeave isn’t just riding the AI wave—it’s selling the surfboards.
On Tuesday, Oklo steps up. The nuclear-power startup is expected to show growth tied to feeding energy-hungry AI data centers. Yes, we’ve apparently reached the point where AI earnings season now includes a nuclear company.
Midweek, Cisco reports after nearly doubling its AI revenue target last quarter—because even the internet needs an internet upgrade for AI. And Thursday brings Applied Materials, the chipmaking equipment giant currently navigating U.S. restrictions on selling gear to China. (Nothing says “earnings drama” like geopolitics.)
Also on Thursday, Disney takes the mic. The mouse has been busy—rolling out an ESPN standalone app and trying to gobble up NFL Network like a late-night snack.
Other companies popping into the earnings group chat include:
Circle (the stablecoin shop behind USDC)
Flutter (parent of FanDuel, the reason your friend cares about obscure NBA games)
Rocket Lab (shoots satellites into space)
On Holdings (makers of pricey, cloud-like running shoes that your knees will thank you for)
And just when you thought we were done talking about AI, AMD is hosting an analyst day Tuesday, where CEO Lisa Su is expected to drop more details on the company’s AI roadmap.
🤔 Which companies are poised to possibly over- or underreact to earnings this week?
Shares of this week’s biggest reporting company (Cisco Systems) have a history of moving a bit less than the market expects during the trading session immediately following earnings.
Of the 20 largest companies reporting earnings this week, Sony Group’s ADR shows the strongest likelihood of moving more than the market expects during the trading session immediately following earnings (keep reading below the next table for more details on how this is calculated).
Conversely, of the top 20 companies reporting this week, Global Foundries has a history of remaining within its post-earnings expected range (keep reading below the next table for more details).
👇 Below is a look at this week’s biggest earnings reports, sorted by market cap.
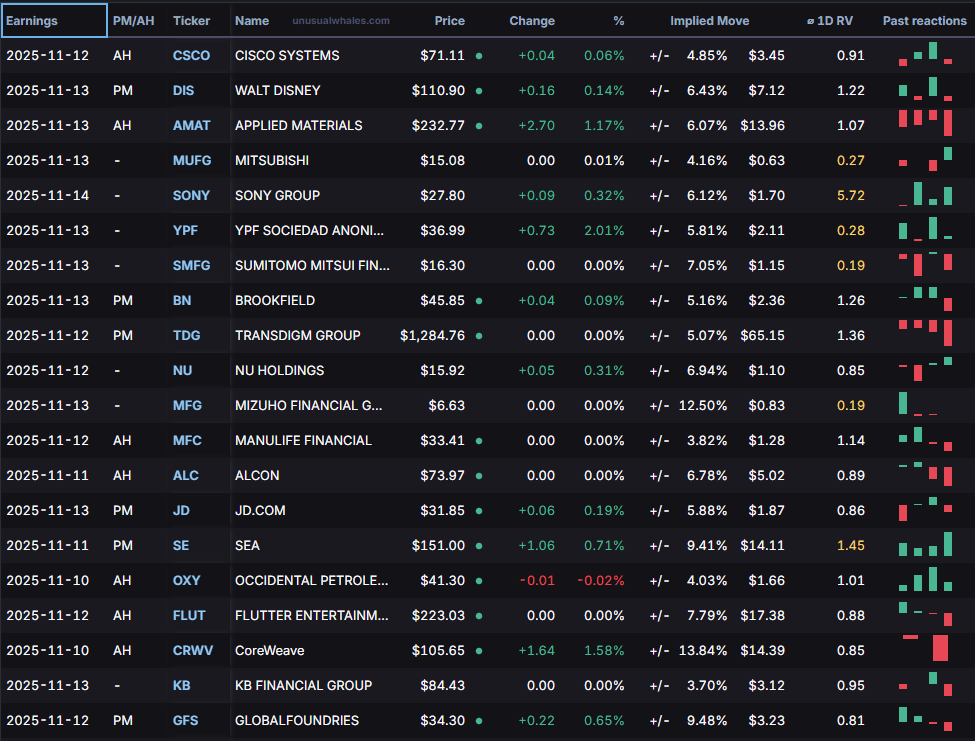
HOW CAN TRADERS USE THIS INFORMATION?
For active traders looking for actionable insights, the highlighted columns on the table above show the implied (expected) post-earnings move for each company, along with the Average 1-Day Realized Volatility Post Earnings Ratio (1D RV).
📈Implied Move: The market’s best guess at how much a stock will swing after earnings.
📊1D RV: A powerful tool that represents the post-earnings price move divided by the expected price move over the past 12 quarters. In other words, it measures how good (or bad) the market is at pricing each company’s earnings.
💵When you see a ratio >1.0, it indicates that, historically, the earnings are mispriced and the stock moves MORE than the market anticipates, favoring straddle buyers.
🪝A ratio <1.0 tells the opposite story, meaning the stock historically moves LESS than the market anticipates, which favors straddle sellers.
Happy hunting.
Since the tariff tantrum lows of April, pullbacks in the benchmark S&P 500 have remained brief and shallow. Even as momentum and the number of stocks participating in the rally (i.e., breadth) have diverged in recent weeks, any technical damage has remained minimal.
When it comes to yellow flags, momentum and breadth are among the most widely used indicators. But the real “canary in the coal mine” that many professional traders and investors use to confirm when real trouble might be brewing for risk assets is high-yield credit spreads.
Since junk-rated companies sit at the edge of financial resilience, their borrowing costs spike early when credit conditions sour, making spreads a fast, forward-looking gauge of weakening risk appetite. In other words, when credit investors start demanding a bigger safety premium to get paid, it’s often the first alarm that the broader market’s default risk is increasing, liquidity is tightening, or the economy is becoming stressed—often before equities crack.
The chart below shows the Bank of America (BofA) High Yield Index (blue line) against the S&P 500 (green line). The green arrow shows risk premiums on high-yield bonds coming close to their tightest (lowest) levels of the year as recently as September.
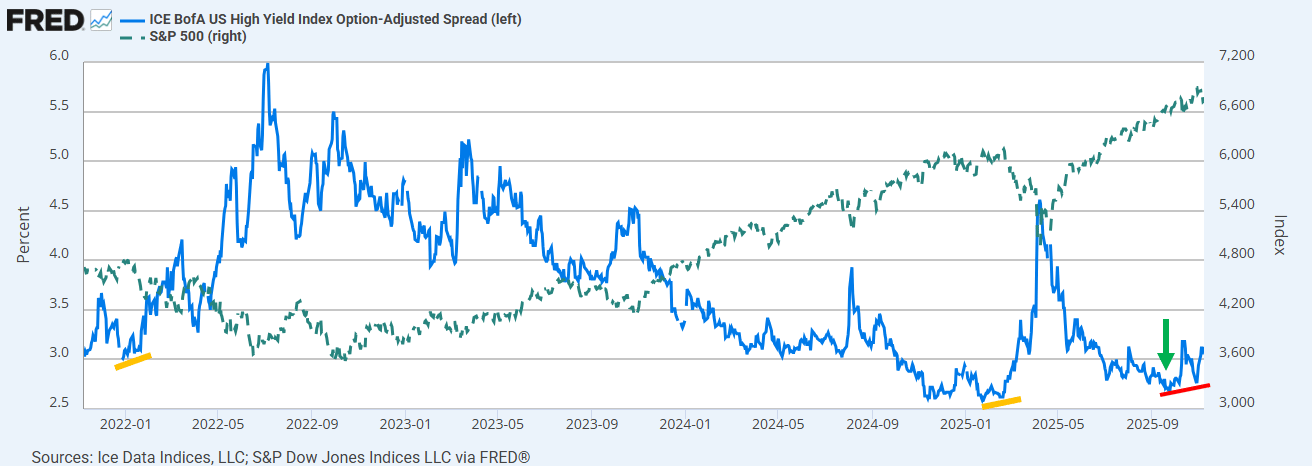
As we start the second full week of trading in what is historically the strongest month of the year for equities, stocks are responding favorably this morning to news of a possible end to the shutdown. Also, spreads have not widened significantly since their September lows.
While these are all very favorable signs, active traders should be keeping an eye out for possible signs that credit spreads are continuing to widen, especially after the divergence (new stock market high vs. wider spreads) that occurred in late October (red line). That’s because this chart also shows instances where past divergences have preceded prolonged stock market corrections.
The Bottom Line
The recent widening in credit spreads remains under control as the benchmark S&P 500 continues to hold key levels of price support. Given the slowing momentum and poor breadth that accompanied the S&P 500 at its late-October highs, however, the potential exists for the pullback from those highs to be the most prolonged since the start of the post-April rally.
As long as the Bank of America (BofA) High Yield Index does not continue to rise (widen) uncontrollably from here, the odds favor a continued stock market correction that remains relatively controlled and orderly, rather than something more precipitous.

📉 Trump proposes 50-year mortgages to make home buying more affordable: The plan floated by Donald Trump to offer 50-year home loans promises lower monthly payments but comes with steep trade-offs like slower equity buildup and legal obstacles under the Dodd‑Frank Wall Street Reform and Consumer Protection Act. Read more

🚗 Tesla’s “new chapter” begins as Elon Musk gets his $1 trillion pay package: With shareholders approving a massive pay plan, Elon Musk stands to become the world’s first trillionaire—if he hits a laundry list of wild targets like robotaxis, 12 million EVs a year, and a market cap of $8.5 trillion. Read more
💊 Evolocumab cuts MACE risk in patients without prior MI / stroke — VESALIUS-CV: A breakout study found that PCSK9-inhibitor Evolocumab helped reduce major adverse cardiovascular events in high-risk patients with no prior heart attack or stroke, hinting at a stronger front-line defense for heart health. Read more
💸 Trump again promises $2,000 tariff dividend as SCOTUS decision looms: President Trump is doubling down on his pitch to send Americans a $2,000 check from tariff revenue—just as the Supreme Court of the United States weighs the legality of those tariffs and voters remember who funded the price hikes. Read more
🇨🇳 China’s factory-gate deflation eases in October, consumer prices rise: Consumer prices in China ticked up 0.2 % year-over-year in October, reversing a drop, while factory-gate prices continued to slump for the 37th straight month—so yes: inflation is back, but the mood’s still “thawing,” not thawed. Read more

Not surprisingly, with the CBOE Volatility Index (VIX) recently trending toward three-week highs, the expected price range for all 11 sector ETFs continues to expand.
Technology (XLK), consumer discretionary (XLY), and energy (XLE) continue to show expectations for the largest price swings this week.
Conversely, utilities (XLU) now join real estate (XLRE) and healthcare (XLV) as the sectors that are expected to house some of the smallest price moves.
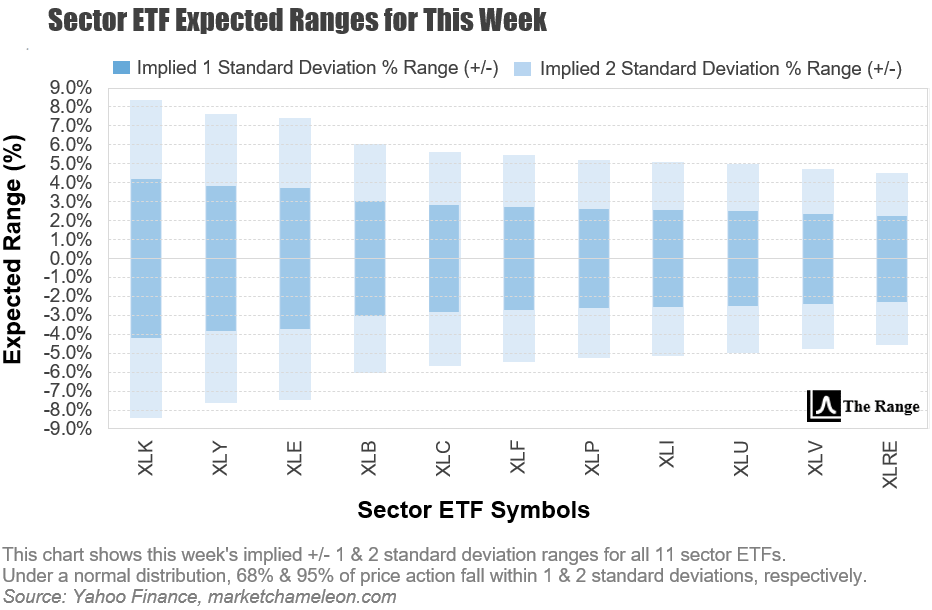
ℹ️ WHY IS THIS IMPORTANT?
For options traders in particular: Implied volatility sets the tone for option prices. Understanding where large or small implied moves are priced in helps traders decide whether options are over- or under-valued before placing trades.

Monday
Top Earnings: CoreWeave, Occidental Petroleum, Rocket Lab, AST Space Mobile, Tyson Foods
Tuesday (Stock market is open, bond market is closed)
AMD 2025 analyst day
NFIB small business optimism
Top Earnings: Sony Group, Oklo, Nebius Group
Wednesday
Top Earnings: Cisco Systems, Manulife Financial, Flutter Entertainment, Tencent Music, Circle Internet Group, On Holding
Thursday
Monthly U.S. federal budget
Shutdown-delayed data: Consumer Price Index, Initial jobless claims
Top Earnings: Walt Disney, Applied Materials, Brookfield, JD.com
Friday
Shutdown-delayed data: Retail sales, Producer Price Index, Business inventories
Fed Speakers: Kansas City Fed President Jeff Schmid, Dallas Fed President Lorie Logan

Volatility, as measured by the VIX, spiked up to the 22.70 area which has acted as resistance many times in the past, before reversing lower on Friday.
While this may set the stage for volatility to subside a bit this week, we won’t get excited about a prolonged period of lower volatility until VIX (19.08 as of Friday’s close) gives up its stubbornly elevated stance above the 50-day moving average at 17.31.
Until this happens, daily moves remain prone to outsized swings.
📝 EDITOR’S NOTE
Each day the market is open, we update our comprehensive performance charts on our website for you to view. In addition, be sure to follow us on X for timely intra-week updates.

📋Here’s a curated list of top value-added insights that uncover what’s happening way beyond the usual financial media headlines.

Please be sure to follow us on X.
If you like what we're doing, please forward us to a friend. If you're not already subscribed, join our growing family of free subscribers.
Reply